1,安装Anaconda后,在cmd中,查看Bokeh库的版本:
conda list
2.将Bokeh更新至1.1.0版本
conda instal bokeh=1.1.0
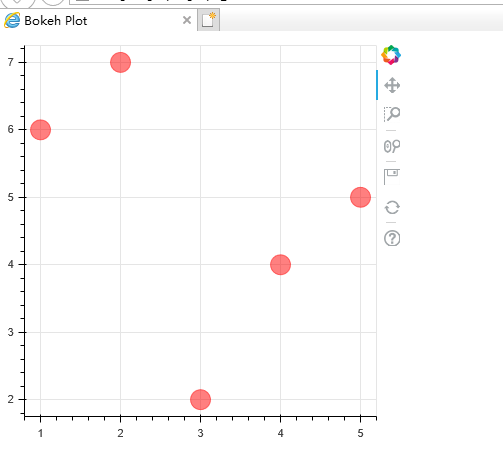
3.散点图:
1 def scatter():
2     x=[1,2,3,4,5]
3     y=[6,7,2,4,5]
4
5     p=figure(plot_width=400,plot_height=400)
6     p.circle(x,y,size=20,color='red',alpha=0.5)
7     show(p)
结果:
4.使用iris数据集,对
"petal_length", "sepal_width"这两个属性进行类别的分布显示。
from bokeh.plotting import figure,show
def iris():
    from bokeh.sampledata.iris import flowers
    from bokeh.transform import factor_cmap, factor_mark
    # print(flowers) # 150*3,属性:sepal_length  sepal_width  petal_length  petal_width    species
    # 鸢尾花品种及分类标记
    SPECIES = ['setosa', 'versicolor', 'virginica']
    MARKERS = ['hex', 'circle_x', 'triangle'] # 类别标记
    # 画布
    p = figure(title="Iris Morphology", background_fill_color="#fafafa") # title:画布的命名,第二个参数,背景颜色填充
    # 绘图,(x坐标,y坐标,data_source,marker:标记了,color:颜色填充,)
    p.scatter("petal_length", "sepal_width", source=flowers, legend="species", fill_alpha=0.4, size=12,
              marker=factor_mark('species', MARKERS, SPECIES),
              color=factor_cmap('species', 'Category10_3', SPECIES))
    # 取了两个属性
    p.xaxis.axis_label = 'Petal Length' # 横坐标描述
    p.yaxis.axis_label = 'Sepal Width' # 纵坐标描述
    # 显示
    show(p)
