上两篇讲了Feign和Ribbon如何集成Hystrix。本篇进一步讲如何实现Hystrix监控。
1、创建一个名称为spring-cloud-hystrix-dashboard的模块
2、build.gradle配置
1 dependencies {
2     compile("org.springframework.cloud:spring-cloud-starter-netflix-hystrix")
3     compile("org.springframework.cloud:spring-cloud-starter-netflix-hystrix-dashboard")
4 }
3、创建监控启动类
第5行加@EnableHystrixDashboard注解即可。
 1 /**
 2  * @author Leo
 3  */
 4 @SpringBootApplication
 5 @EnableHystrixDashboard
 6 public class HystrixDashboardApplication {
 7
 8     public static void main(String[] args) {
 9
10         SpringApplication.run(HystrixDashboardApplication.class, args);
11     }
12 }
4、bootstrap.yml配置文件
1 spring:
2   application:
3     name: spring-cloud-hystrix-dashboard
4
5 server:
6   port: 8070
到此Hystrix Dashboard监控服务端配置完成。
接下来对之前已经集成Hystrix的x-demo-service-feign和x-demo-service-ribbon两个模块进行改造
5、x-demo-service-feign启动类增加@EnableCircuitBreaker注解
 1 /**
 2  * @author Leo
 3  */
 4 @SpringBootApplication
 5 @EnableEurekaClient
 6 @EnableFeignClients
 7 @EnableCircuitBreaker
 8 public class FeignServerApplication {
 9
10     public static void main(String[] args) {
11         SpringApplication.run(FeignServerApplication.class, args);
12     }
13 }
6、x-demo-service-feign配置文件增加endpoints配置
因为在Spring boot2.0后,为了安全,默认 Actuator 只暴露了2个端点,heath 和 info。
 1 spring:
 2   application:
 3     name: x-demo-service-feign
 4
 5 server:
 6   port: 8092
 7
 8 eureka:
 9   client:
10     serviceUrl:
11       defaultZone: http://localhost:8761/eureka/,http://localhost:8762/eureka/,http://localhost:8763/eureka/
12
13 feign:
14   hystrix:
15     enabled: true
16
17 management:
18   endpoints:
19     web:
20       exposure:
21         include: '*'
22   endpoint:
23     health:
24       show-details: ALWAYS
x-demo-service-ribbon按照上面5,6步,完成同样改造。
7、依次启动eureka-server,x-demo-service,x-demo-service-feign,x-demo-service-ribbon,最后启动spring-cloud-hystrix-dashboard。
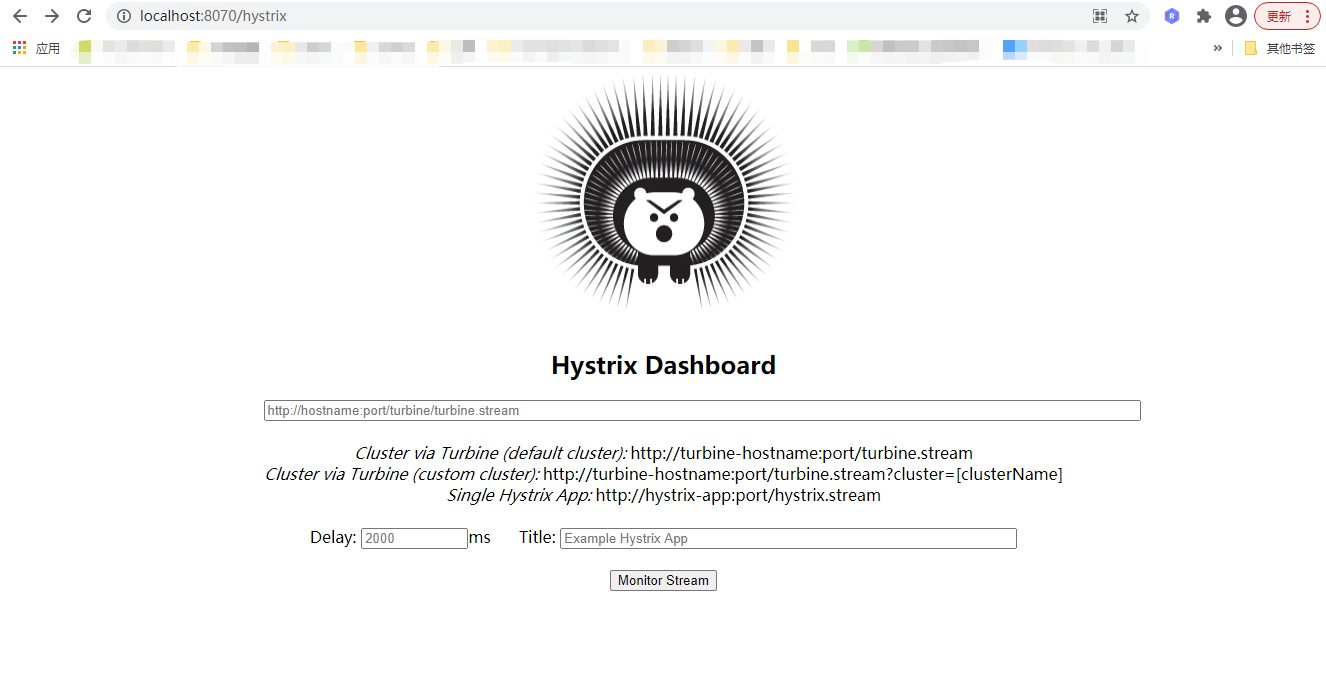
访问hystrix dashboard监控平台:http://localhost:8070/hystrix,如下图
8、访问http://localhost:8091/ribbon/service,http://localhost:8092/feign/service,可以多刷新几次,目前是造一些监控数据。
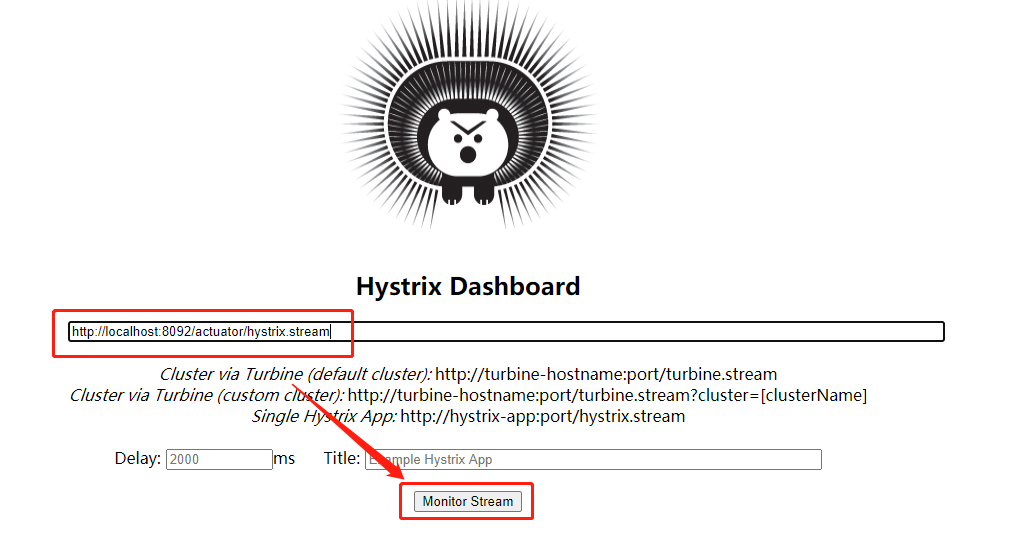
然后在Hystrix Dashboard页面输入http://localhost:8091/actuator/hystrix.stream,http://localhost:8092/actuator/hystrix.stream,点击下方Monitor Stream按钮,查看服务监控数据。
以http://localhost:8092/actuator/hystrix.stream为例。
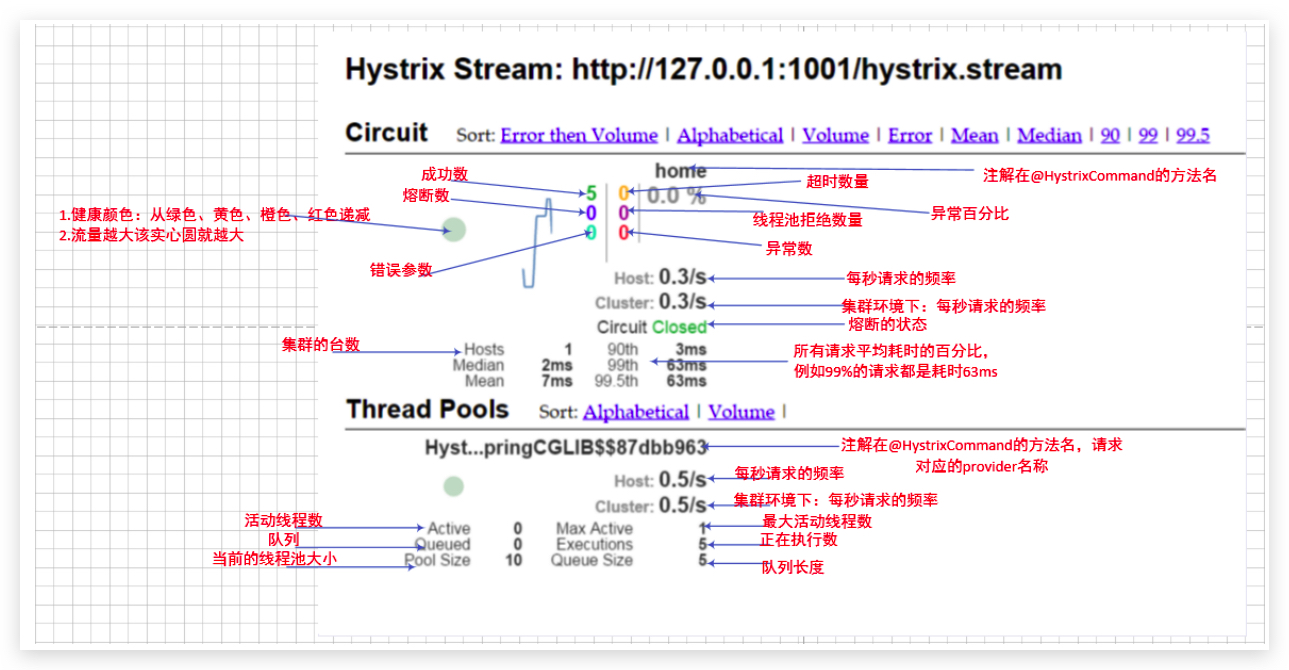
9、服务监控数据
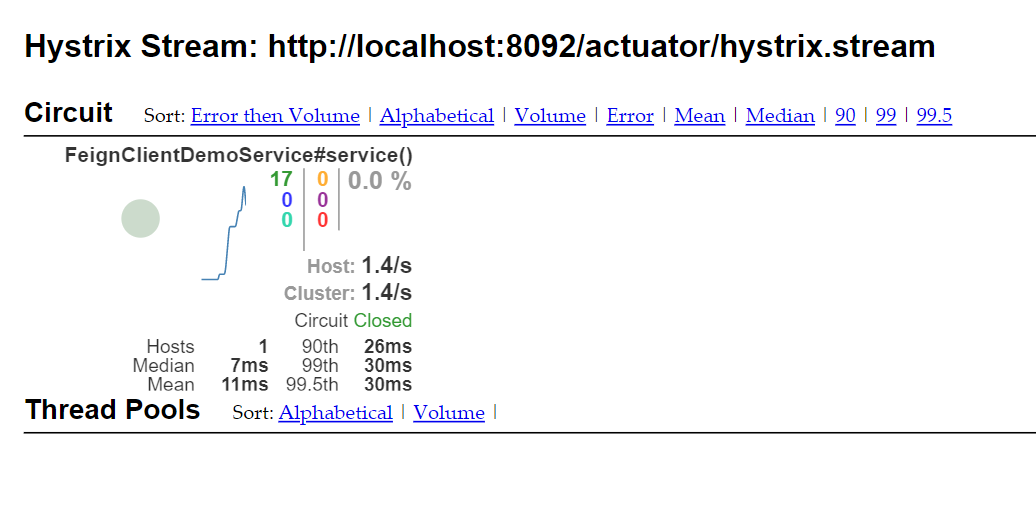
至此,Hystrix Dashboard监控搭建完成。上图中有很多指标,我从网上找到了一个比较详细的参数说明,如下图,感兴趣的小伙伴自己看看吧。