代码:
import numpy as np
from sklearn import datasets
from sklearn import metrics
from sklearn import model_selection as modsel
from sklearn import linear_model
%matplotlib inline
import matplotlib.pyplot as plt
plt.style.use('ggplot')
boston = datasets.load_boston()
print(dir(boston))
print(boston.data.shape)
print(boston.target.shape)
x_train,x_test,y_train,y_test = modsel.train_test_split(boston.data,boston.target,test_size=0.1,random_state=42)
linreg = linear_model.LinearRegression()
linreg.fit(x_train, y_train)
# linreg.predict(x_train) 是预测值
print('预测值的方差: ' + str(metrics.mean_squared_error(y_train, linreg.predict(x_train))))
print('预测值的确定系数(R方值): ' + str(linreg.score(x_train, y_train)))
y_pred = linreg.predict(x_test)
metrics.mean_squared_error(y_test,y_pred)
plt.figure(figsize=(10,6))
plt.plot(y_test,linewidth=3,label='ground truth')
plt.plot(y_pred,linewidth=3,label='predicted')
plt.legend(loc='best')
plt.xlabel('test data point')
plt.ylabel('target value')

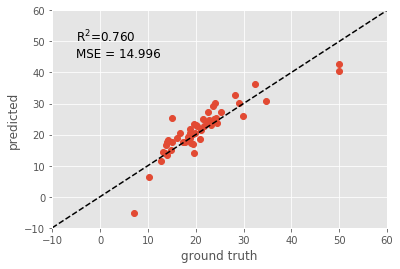
plt.plot(y_test,y_pred,'o')
plt.plot([-10,60],[-10,60],'k--')
plt.axis([-10,60,-10,60])
plt.xlabel('ground truth')
plt.ylabel('predicted')
scorestr = 'R$^2$=%.3f'%linreg.score(x_test,y_test)
errstr = 'MSE = %.3f' %metrics.mean_squared_error(y_test,y_pred)
plt.text(-5,50,scorestr,fontsize=12)
plt.text(-5,45,errstr,fontsize=12)