httprouter使用pprof
参考:https://github.com/feixiao/httpprof
https://xguox.me/go-profiling-optimizing.html/
性能分析参考:https://github.com/caibirdme/hand-to-hand-optimize-go
/debug/pprof/profile:访问这个链接会自动进行 CPU profiling,持续 30s,并生成一个文件供下载
/debug/pprof/block:Goroutine阻塞事件的记录。默认每发生一次阻塞事件时取样一次。
/debug/pprof/goroutines:活跃Goroutine的信息的记录。仅在获取时取样一次。
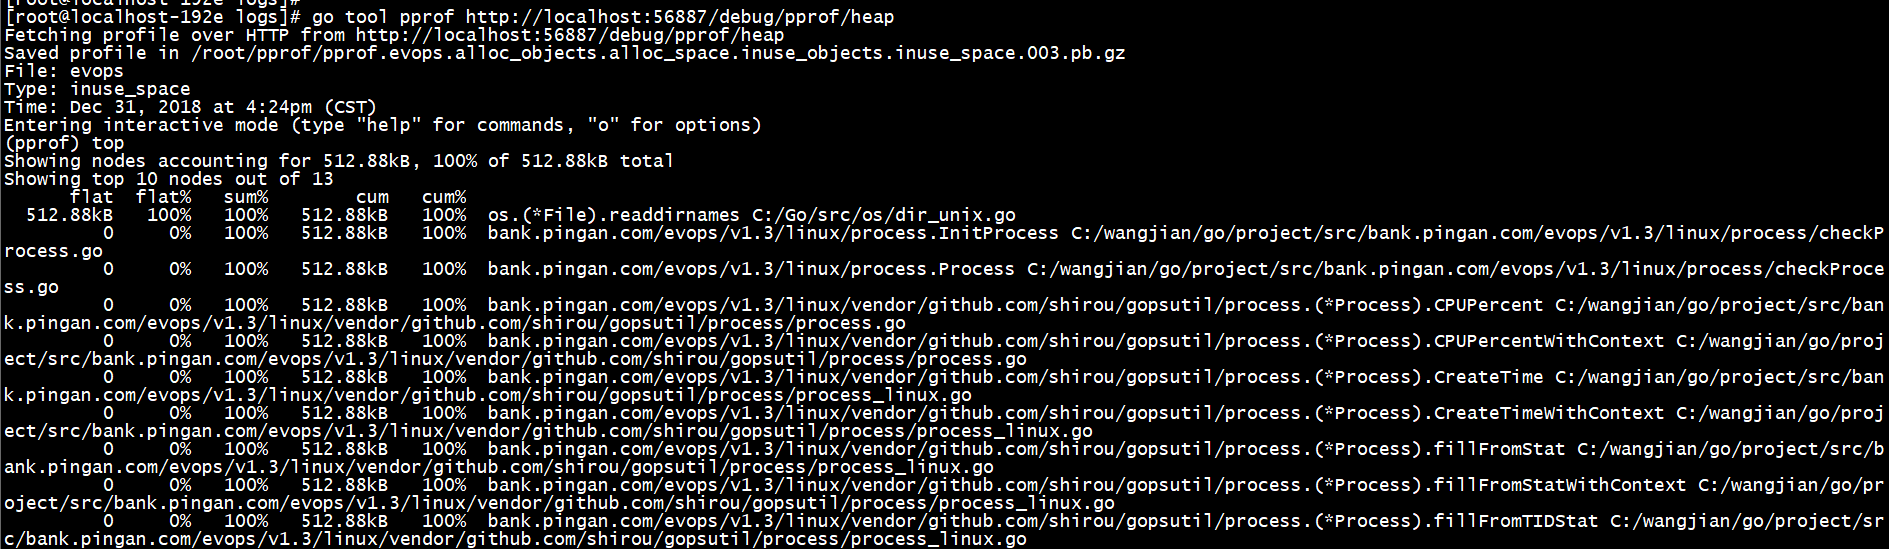
/debug/pprof/heap: 堆内存分配情况的记录。默认每分配512K字节时取样一次。
/debug/pprof/mutex: 查看争用互斥锁的持有者。
/debug/pprof/threadcreate: 系统线程创建情况的记录。 仅在获取时取样一次。
go tool pprof http://localhost:6060/debug/pprof/profile?seconds=600
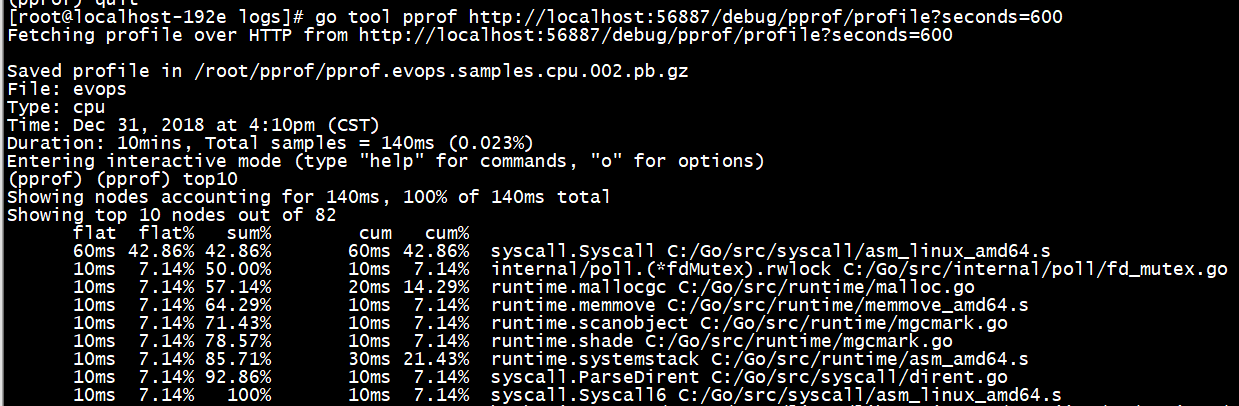
- flat:给定函数上运行耗时
- flat%:同上的 CPU 运行耗时总比例
- sum%:给定函数累积使用 CPU 总比例
- cum:当前函数加上它之上的调用运行总耗时
- cum%:同上的 CPU 运行耗时总比例
go tool pprof http://localhost:56887/debug/pprof/heap
-
-inuse_space:分析应用程序的常驻内存占用情况
-
-alloc_objects:分析应用程序的内存临时分配情况