Matplotlib 官方API地址:https://matplotlib.org/
例子:
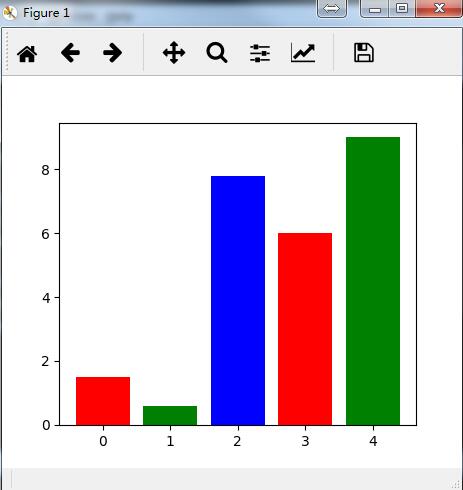
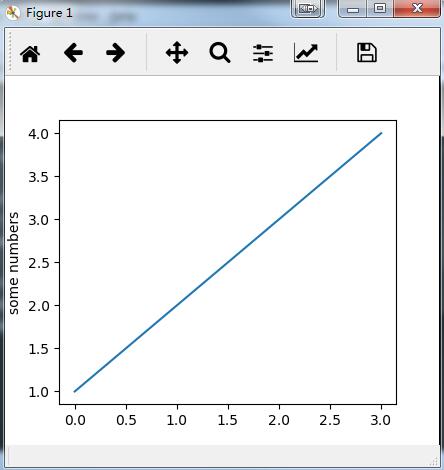
import matplotlib.pyplot as plt

num_list=[1.5,0.6,7.8,6,9]
plt.bar(range(len(num_list)),num_list,color='rgb')
plt.show()

plt.plot([1,2,3,4])
plt.ylabel('some numbers')
plt.show()
Matplotlib 官方API地址:https://matplotlib.org/
例子:
import matplotlib.pyplot as plt num_list=[1.5,0.6,7.8,6,9] plt.bar(range(len(num_list)),num_list,color='rgb') plt.show() plt.plot([1,2,3,4]) plt.ylabel('some numbers') plt.show()