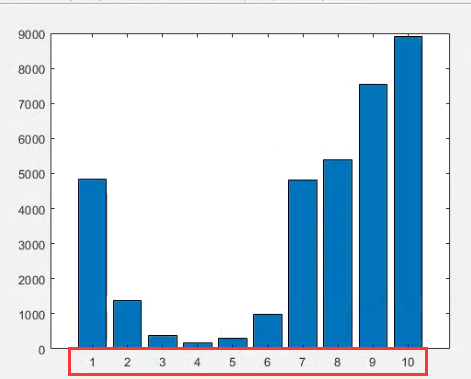
使用MATLAB 画柱状图 ,即bar (x,y),其横坐标是默认 1、2、3、4、……的
% --v1
y1=[asum1,asum2,asum3,asum4,asum5,asum6,asum7,asum8,asum9,asum10];
x1=[1:10];
bar(x1,y1)
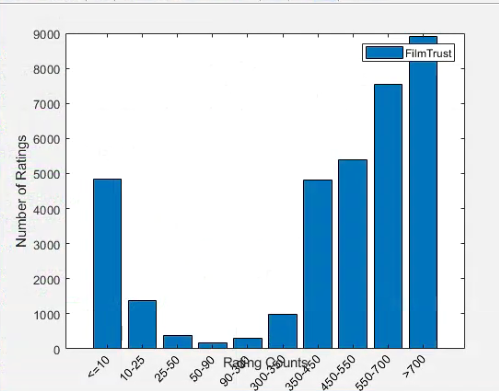
现在需要修改横坐标名称,使用命令:
% --v2
y2=[asum1,asum2,asum3,asum4,asum5,asum6,asum7,asum8,asum9,asum10];
x2=['<=10','10-25','25-50','50-90','90-300','300-350','350-450','450-550','550-700','>700'];
bar(y2)  %先 bar 后 set
set(gca,'XTickLabel',x2)

但是显示的时候出现文字重叠情况……
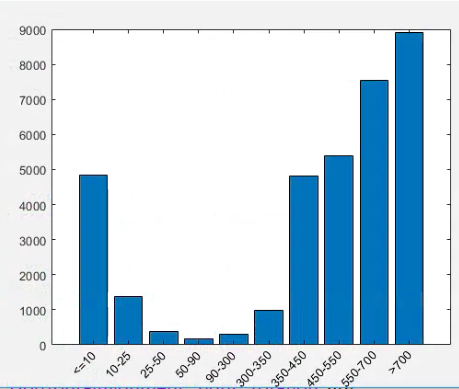
那么,更进一步的,使其名称横着显示:
% --v3
y3=[asum1,asum2,asum3,asum4,asum5,asum6,asum7,asum8,asum9,asum10];
x3str={'<=10','10-25','25-50','50-90','90-300','300-350','350-450','450-550','550-700','>700'}; %新坐标的值
bar(y3)  %先 bar 后 set
xtb = get(gca,'XTickLabel');% 获取横坐标轴标签句柄
xt = get(gca,'XTick');% 获取横坐标轴刻度句柄
yt = get(gca,'YTick'); % 获取纵坐标轴刻度句柄
xtextp=xt;%每个标签放置位置的横坐标,这个自然应该和原来的一样了。
ytextp=-0.1*yt(3)*ones(1,length(xt));
text(xtextp,ytextp,x3str,'HorizontalAlignment','right','rotation',46)
set(gca,'XTickLabel',[]); %将原坐标(1,2,3,..)去掉
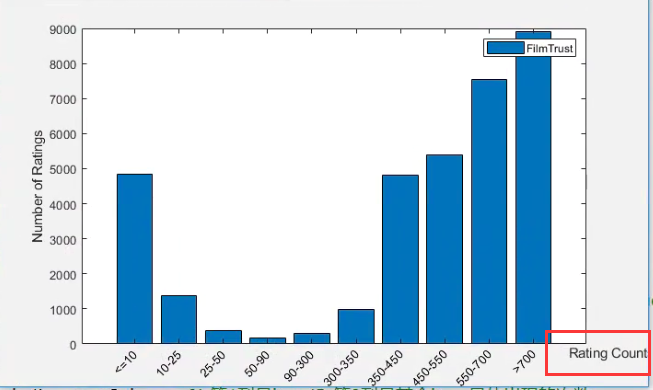
最终,加上 label :
%--添加坐标提示
xlabel('Rating Counts');
ylabel('Number of Ratings');
legend('FilmTrust');
设置 xlabel在右边而非中间:
(最终版代码)
% --v3
y3=[asum1,asum2,asum3,asum4,asum5,asum6,asum7,asum8,asum9,asum10];
x3str={'<=10','10-25','25-50','50-90','90-300','300-350','350-450','450-550','550-700','>700'}; %新坐标的值
bar(y3)  %先 bar 后 set
xtb = get(gca,'XTickLabel');% 获取横坐标轴标签句柄
xt = get(gca,'XTick');% 获取横坐标轴刻度句柄
yt = get(gca,'YTick'); % 获取纵坐标轴刻度句柄
xtextp=xt;%每个标签放置位置的横坐标,这个自然应该和原来的一样了。
ytextp=-0.1*yt(3)*ones(1,length(xt));
text(xtextp,ytextp,x3str,'HorizontalAlignment','right','rotation',46)
set(gca,'XTickLabel',[]); %将原坐标(1,2,3,..)去掉
%--添加坐标提示
xlabel('Rating Counts');
ylabel('Number of Ratings');
legend('FilmTrust');
% ----设置 xlabel在右边而非中间
h=xlabel('Rating Counts');
xlim = get(gca,'XLim');
ylim = get(gca,'YLim');
set(h,'Position',[xlim(2)+(xlim(2)-xlim(1))*0.05,ylim(1)])