实现地上、地表、地下多源数据的融合与可视化表达,构筑智能决策模型库,打造模型管理系统,实现应用功能的可定制化,为智慧城市的规划、建设、管理全流程提供决策支撑。
规划设计辅助决策系统:为提升规划设计方案审批决策的科学性,提供人流动态分析、人口分布分析、开发强度分析、公共设施服务分析等专业辅助分析功能,从各项专业指标评估设计方案的合理性;按照规划设计编制技术规则,提供指标分析、通视分析、视域分析、天际线分析等方案影响评估功能,对规划设计的景观风貌控制要素进行引导,为促进城市景观实体、景观空间的塑造及城市环境的改善提供准确的分析结果。
建设管理系统:以信息化建设为抓手,为政府职能部门提供信息化监管手段,为施工企业提供信息化管理支撑。有效地降低政府的监管成本、提高监管效率,解决政府监管人手不足、监管手段落后、监管信息化建设短缺等问题。同时,建设企业可实时了解施工现场安全情况、扬尘污染情况,掌握施工进度,降低自身管理成本,提升施工质量。
城市运营管理系统:城市运营管理系统面向城市经营者,主要提供城市智慧治理、可视化应急管理和空间资产管理功能。城市智慧治理主要在生态环境监测与治理、交通治理等方面提供指挥分析功能,辅助城市治理决策;可视化应急管理通过物联网、大数据、云计算等技术,为城市可能发生的应急情况进行预案、监测、预警、处置、跟踪、追溯、分析,以更好的防止应急事故的发生,在应急事故发生后作出更科学的处置措施;城市空间资产管理模块提供不动产二三维一体化权籍信息管理、不动产大数据挖掘与分析功能。
![]()
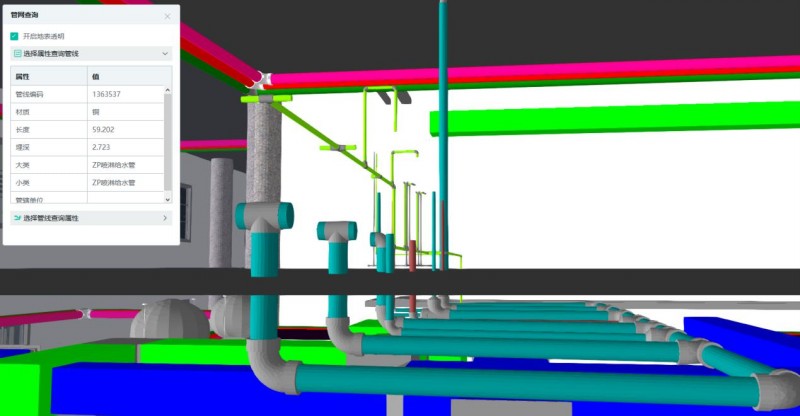
属性查询
![]()
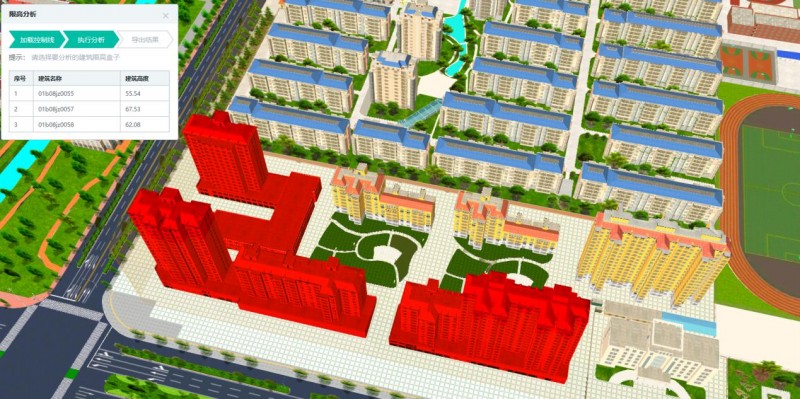
限高分析
![]()
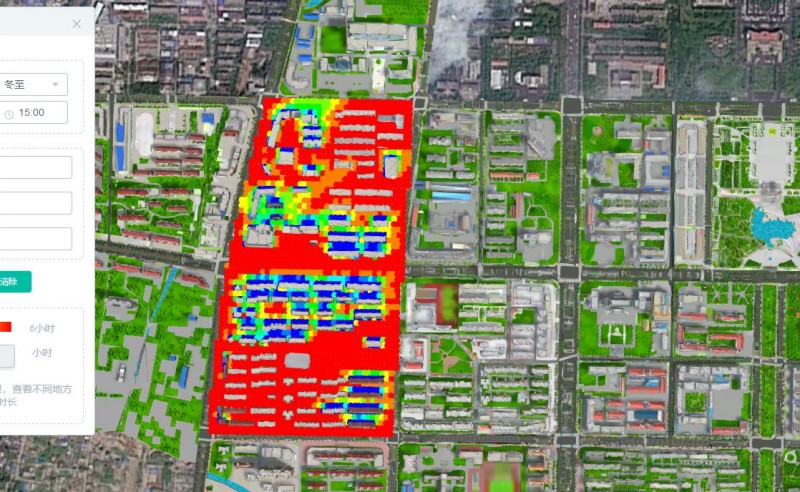
日照分析
![]()
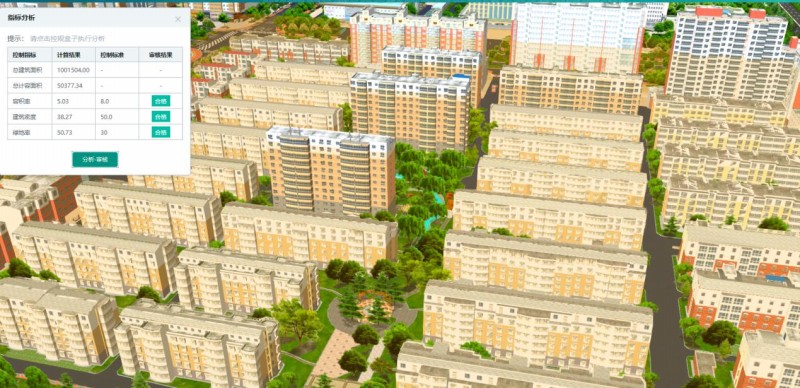
指标审查
![]()