蛮复杂的样子
根据官方文档指导,一步一步走起:https://book.open-falcon.org/zh_0_2/quick_install/prepare.html
单机安装的过程:单击安装会把所有的应用都(server、agent、api、alarm、graph)安装到一个设备上
1、redis、mysql安装无问题:service start redisd/service mysqld start;配置自启动:chkconifg redisd on/chkconfig mysqld on
2、源码编译出现问题,不管,直接用编译好的二机制版本
3、后端安装启动,没有问题 ./open-falcon start/stop/restart [agent/api]
重新加载配置:./open-falcon reload [agent/api]
查看全部或单个应用启动情况:./open-falcon check [agent/api]
监控某个应用:./open-falcon monitor agent
4、前端安装启动,注意下面创建的虚拟环境env,必须在dashboard目录下
virtualenv ./env
启动等命令:sh control start|stop|restart|status|tail|kill9|version|pack
日志查看:sh control tail
注意事项:
1、需要python2.7.x环境,不然安装python依赖包的时候会报错
./env/bin/pip install -r pip_requirements.txt -i https://pypi.douban.com/simple
2、可以yum安装的,就使用yum安装,比如go、mysql、redis
3、中文化:直接修改/home/admin/open-falcon/dashboard/rrd/templates里的内容就可以,比如直接修改navbar.html里的字段,效果

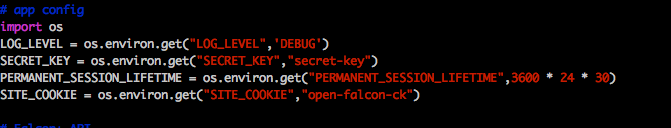
4、配置文件路径:前端dashboard的配置文件 /home/admin/open-falcon/dashboard/rrd/config.py 配置了调用api的端口信息
api的配置文件:api/config/cfg.json。里面配置了api的端口信息
5、log路径,在各个应用下的logs目录,dashboard在其目录下的var目录下
6、开启dashboard的调试模式:dashboard/rrd/config.py
6、有个坑:当api的默认端口8080被其他应用占用的时候,./open-falcon check的时候,falcon-api状态依然是up的状态,但是从api/logs/api.log里可以看到错误信息
7、agent进行分布式安装:
毕竟单机安装只能监控单机的情况,当需要其他机器时,就需要安装agent。
open-falcon的agent用于采集机器负载监控指标,比如cpu.idle、load.1min、disk.io.util等等,每隔60秒push给Transfer。agent与Transfer建立了长连接,数据发送速度比较快,agent提供了一个http接口/v1/push用于接收用户手工push的一些数据,然后通过长连接迅速转发给Transfer。agent项目之前是一个独立项目名字叫falcon-eye ,其自带有web页面来自于linux-dash项目。参考:https://book.open-falcon.org/zh/quick_install/graph_components.html
方法简单:
1、需要把二进制解压后的agent目录和open-falcon执行脚本放入到被监控机器的某个目录。我是把整个目录拷贝过去的,只通过命令行 ./open-falcon start agent 启动agent就可以了
2、修改agent的配置,使其ip信息指向server端:vim agent/config/cfg.json
总共两个IP地址:一个是心跳;一个是transfer应用的。n多个机器上的agent主动把信息发送给server的transfer
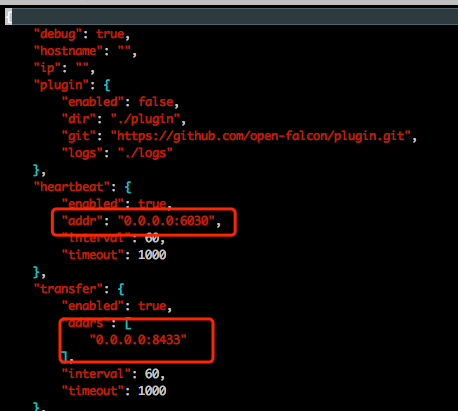
配置涵义:
{
    "debug": true,
    "hostname": "",
    "ip": "",
    "plugin": {
        "enabled": false,  #默认不开启插件机制
        "dir": "./plugin",
        "git": "https://github.com/open-falcon/plugin.git",
        "logs": "./logs"
    },
    "heartbeat": {
        "enabled": true,   #此处enabled要设置为true
        "addr": "0.0.0.0:6030",  #server上hbs的地址,端口是hbs的rpc端口
        "interval": 60,
        "timeout": 1000
    },
    "transfer": {
        "enabled": true,    #此处enabled要设置为true
        "addrs": [
            "0.0.0.0:8433"   #transfer的地址,这里写服务端的IP地址,因为transfer部署在服务端,端口是transfer的rpc端口,这个写多个IP:Port的话,会发给多个Server吗?
        ],
        "interval": 60,
        "timeout": 1000
    },
    "http": {
        "enabled": true,
        "listen": ":1988",
        "backdoor": false
    },
    "collector": {
        "ifacePrefix": ["eth", "em"],     #默认配置只会采集网卡名称前缀是bond、em的网卡流量,配置为空就会采集所有的,lo的也会采集。
        "mountPoint": []
    },
    "default_tags": {
    },
    "ignore": {          #默认采集了200多个metric,可以通过ignore设置为不采集
        "cpu.busy": true,
        "df.bytes.free": true,
        "df.bytes.total": true,
        "df.bytes.used": true,
        "df.bytes.used.percent": true,
        "df.inodes.total": true,
        "df.inodes.free": true,
        "df.inodes.used": true,
        "df.inodes.used.percent": true,
        "mem.memtotal": true,
        "mem.memused": true,
        "mem.memused.percent": true,
        "mem.memfree": true,
        "mem.swaptotal": true,
        "mem.swapused": true,
        "mem.swapfree": true
    }
}
3、agnet启动后,可以访问ip:1988来访问agent的web界面
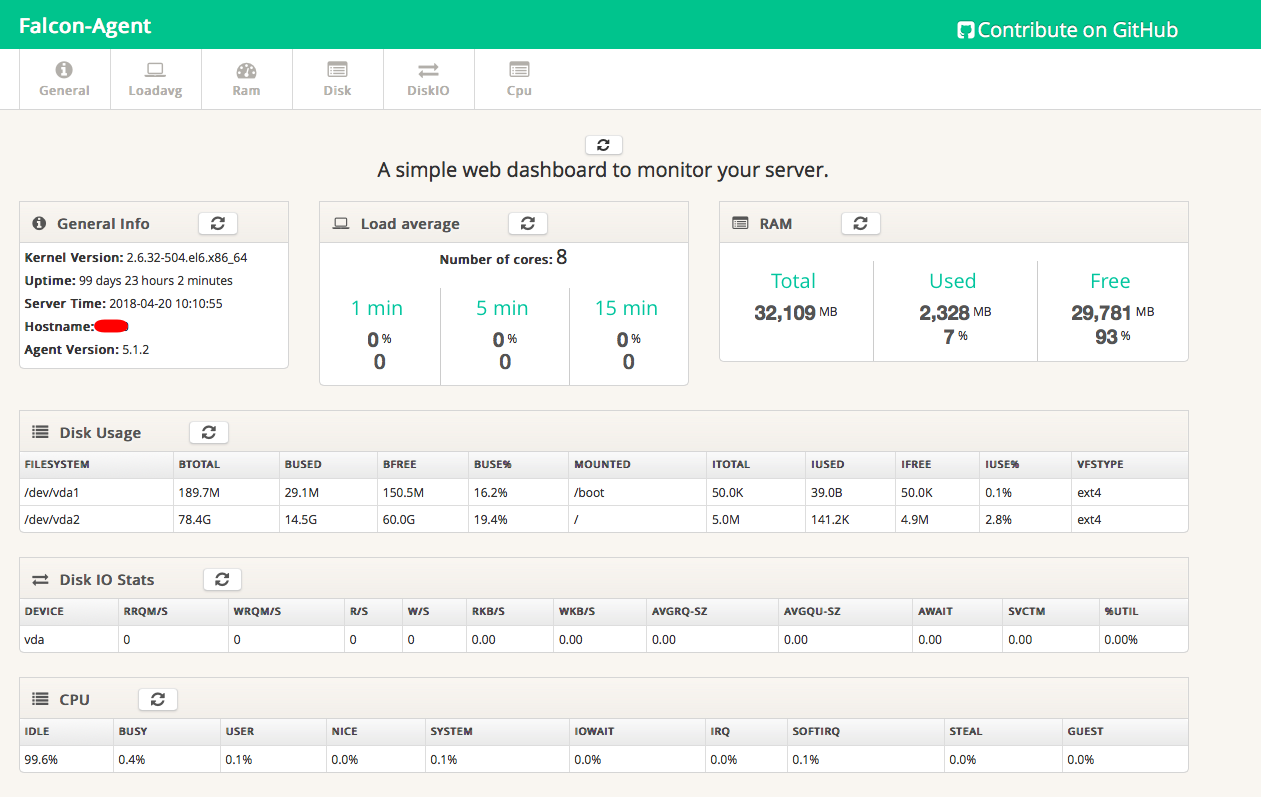
4、agent提供了一个http接口/v1/push用于接收用户手工push的一些数据
所以,你可以本地使用python等语言采集其他信息,然后发送给agent的接口/v1/push
https://github.com/open-falcon可以查看相关的项目和插件脚本
参考:
1、http://open-falcon.org/
2、https://book.open-falcon.org/zh_0_2/
3、https://blog.csdn.net/u012724150/article/details/53309522
4、http://futeng.iteye.com/blog/2071867
5、https://itbilu.com/database/redis/4kB2ninp.html
6、https://blog.csdn.net/dbanote/article/details/12911851
7、http://www.cnblogs.com/kevingrace/p/7361963.html