Echarts雷达图 实例

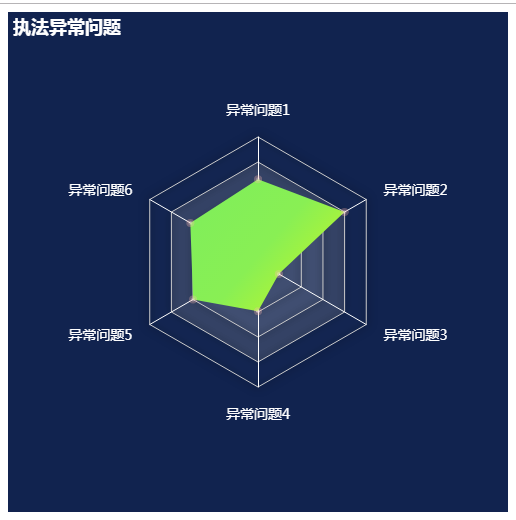
<!DOCTYPE html>
<html lang="en">

<head>
    <meta charset="UTF-8">
    <meta name="viewport" content="width=device-width, initial-scale=1.0">
    <title>Document</title>
    <script src="/echarts.min.js"></script>
</head>

<body>
    <div id="a" style=" 500px; height: 500px; background-color: #11234F;"></div>

</body>
<script>
    var myChart = echarts.init(document.getElementById('a'))
    option = {
        title: {
            text: "执法异常问题",
            textStyle:{
                color:'#fff'
            }
        },
        tooltip: {},
       
        radar: [{
            //这是雷达图的大小
            radius:'50%',
            //图外名称
            name:{
                formatter:'{value}',
                // 字体样式
                textStyle:{
                    fontSize:14,
                    color:'#fff'
                }
            },
            indicator: [{
                name: "异常问题1",
                max: 6500
            }, {
                name: "异常问题6",
                max: 16000
            }, {
                name: "异常问题5",
                max: 30000
            }, {
                name: "异常问题4",
                max: 38000
            }, {
                name: "异常问题3",
                max: 52000
            }, {
                name: "异常问题2",
                max: 25000
            }],
            //文字与图的距离
            nameGap: 20,
            //坐标轴线的设置
            axisLine: {
                show: true,
                lineStyle:{
                    color:'#FFF',

                },
                
            },
            //指示器轴的分割段数
            splitNumber: 5,
            axisTick: {
                color:'#365079',
                
            },
            axisLabel: {},
            splitLine: {
                lineStyle: {
                    shadowBlur: 15,
                    shadowColor: null
                }
            },
            //分割区域是否显示
            splitArea: {
                //分割区域的样式
                areaStyle:{
                    color: ['#fff', '#fff', '#fff', '#c3c3c3','#1F345E'],
                    shadowColor: 'rgba(0, 100, 0, 0.3)',
                    opacity: 0.2,
                }
            }
        }],
        series: [{
            name: "执法异常问题",
            type: "radar",
            data: [{
                value: [4300, 10000, 18000, 15000, 10000, 19990],
                name: "执法异常问题",
                itemStyle: { // 单个拐点标志的样式设置。
                normal: {
                    borderColor: '#FFB9B0',
                    // 拐点的描边颜色。[ default: '#000' ]
                    borderWidth: 4,
                    // 拐点的描边宽度,默认不描边。[ default: 0 ]
                }
            },
            lineStyle: { // 单项线条样式。
                normal: {
                    opacity: 0.5 // 图形透明度
                }
            },
            areaStyle: { // 单项区域填充样式
                normal: {
                    // color: 'red', // 填充的颜色。[ default: "#000" ]
                    //不透明
                    opacity:1,
                    //数据阴影
                    shadowColor:'#2c3F56',
                    // 阴影长度
                    shadowBlur:3,
                    // 阴影偏移
                    shadowOffsetY:2,
                    shadowoffsetX:5,
                    //填充区域颜色渐变
                    color: new echarts.graphic.LinearGradient(
                    0, 0, 1, 1,
                    [
                        // 柱子0%的颜色
                        {offset: 0, color: '#7EEE5c'},
                        //柱子50%的颜色
                        {offset: 0.5, color: '#89EF54'},
                        //柱子100%的颜色
                        {offset: 1, color: '#CFF91E'}
                    ]
                )
                }
            }
             }],
            itemStyle: { // 折线拐点标志的样式。
                normal: { // 普通状态时的样式
                    lineStyle: {
                        0
                    },
                    opacity: 0.3
                },
                emphasis: { // 高亮时的样式
                lineStyle: {
                },
                opacity: 1
            }
            },
        }]
    }
myChart.setOption(option)

</script>

</html>
原文地址:https://www.cnblogs.com/sheep-fu/p/13575488.html