此文为自己翻译,原文链接请看 How to expand color palette with ggplot and RColorBrewer
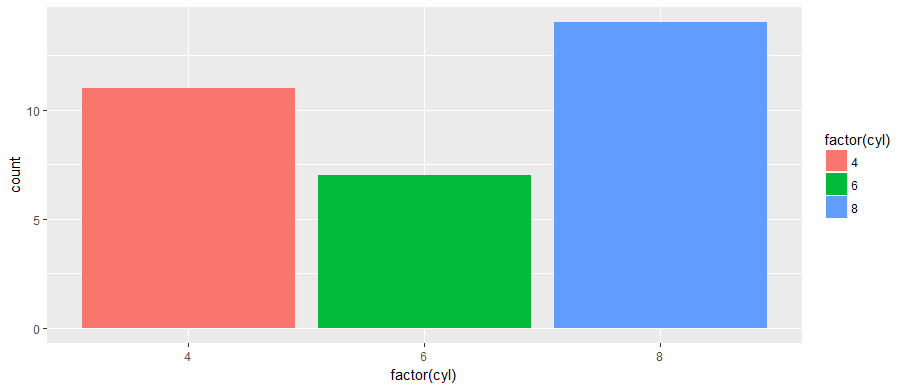
直方图(histogram)和柱状图(bar)是数据分析展示的一部分。如果图是由 R 语言 ggplot2 包中函数 geom_histogram() 或者 geom_bar() 来制作,则柱状图看起来是这样的:
library(ggplot2)

ggplot(mtcars, aes(factor(cyl), fill=factor(cyl))) +
  geom_bar()
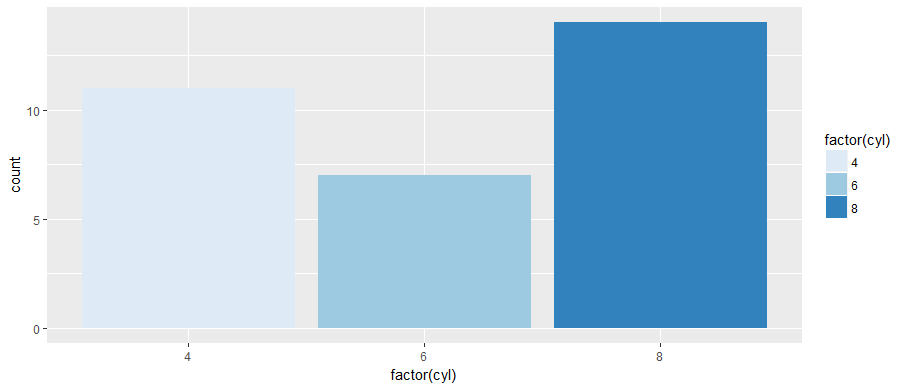
ggplot 函数的优雅在于对可视化公式简单而紧凑的表达,同时隐藏了默认情况下许多假设选项。隐藏选项并不意味着缺少,因为离大多数选择只是一步之遥。例如,对于颜色选择,使用 scale 函数族中的其中一种选择 scale_fill_brewer():
ggplot(mtcars, aes(factor(cyl), fill=factor(cyl))) +
  geom_bar() +
  scale_fill_brewer()
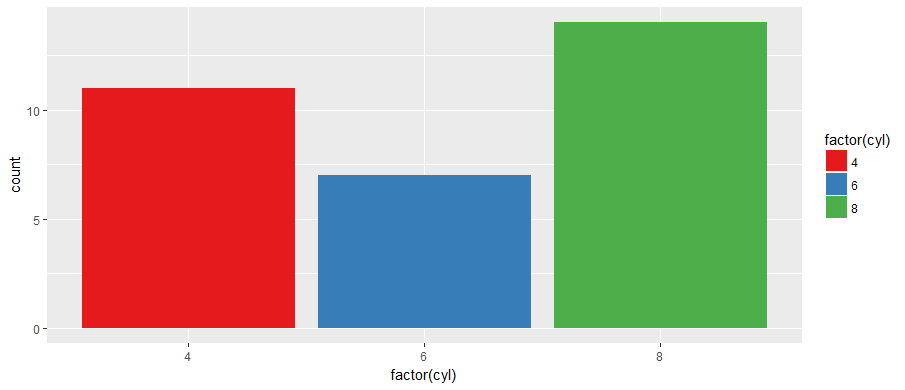
参数 palette 控制着 scale_fill_brewer() 中的颜色选择:
ggplot(mtcars, aes(factor(cyl), fill=factor(cyl))) +
  geom_bar() +
  scale_fill_brewer(palette="Set1")
Palettes 在包 RColorBrewer 中 - 运行 display.brewer.all() 可以看到所有的选择:
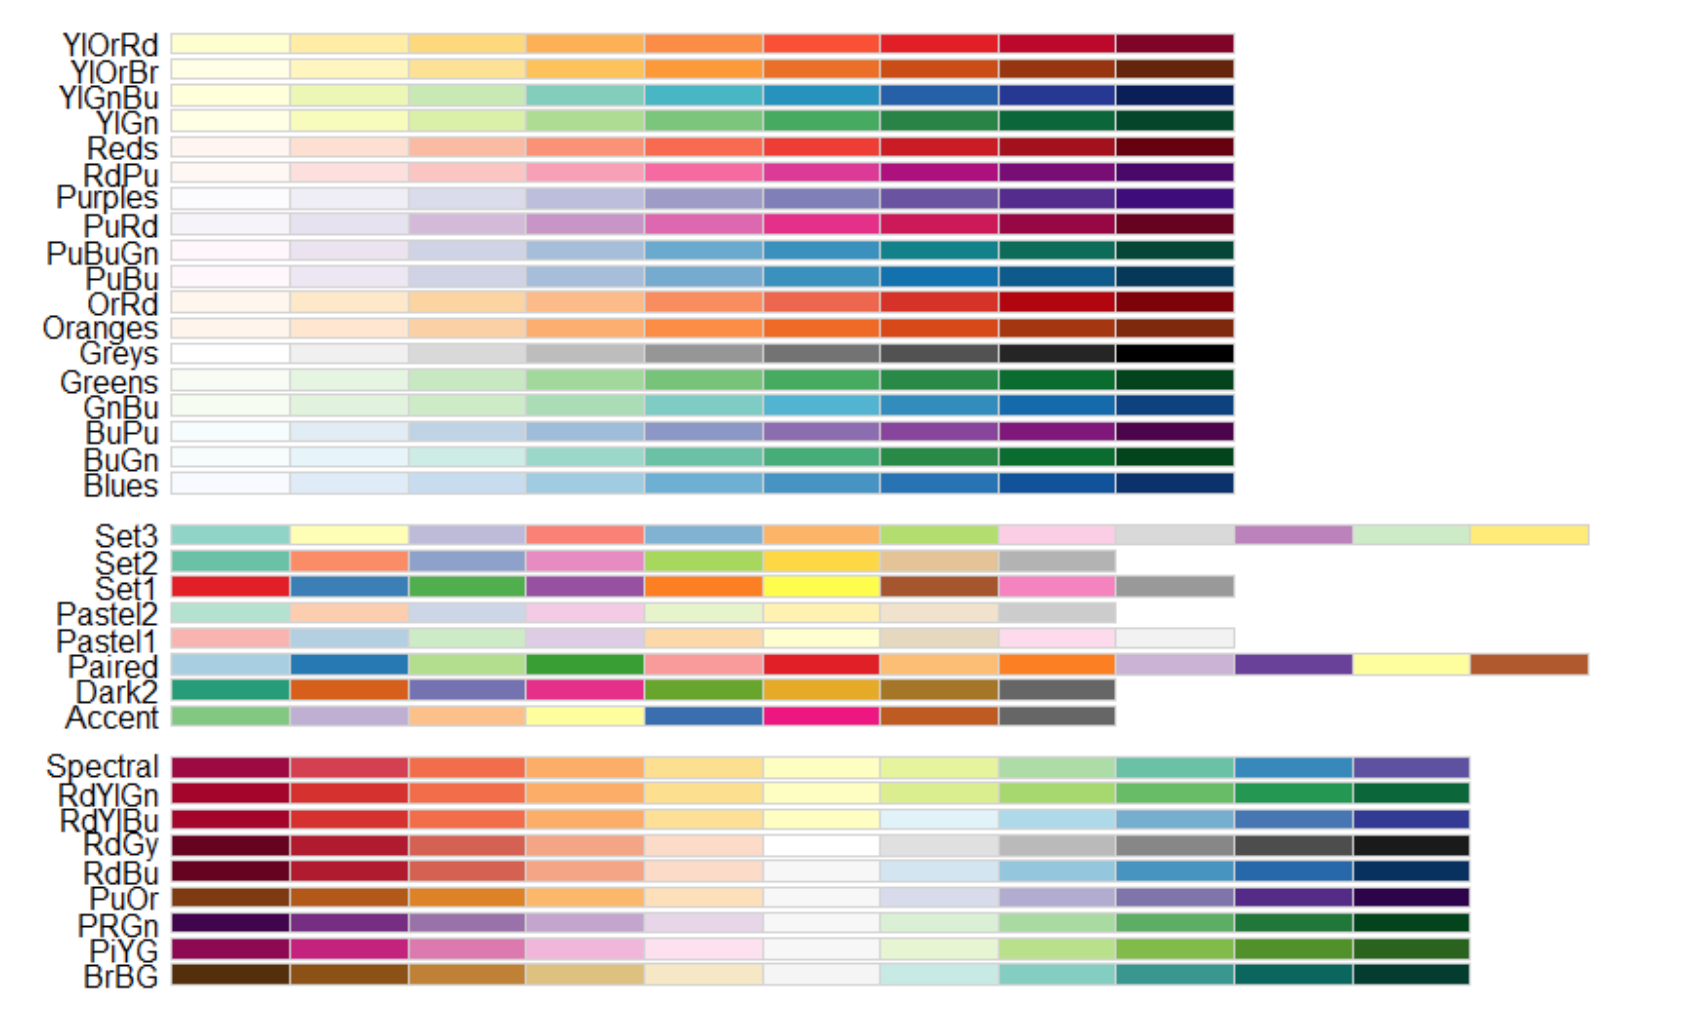
有 3 类调色板(palettes)- sequential,diverging,和 qualitative - 每一类调色板包含 8 到 12 种颜色(可以利用 brewer.pal.info 或者 ?RColorBrewer 看到更多的细节)。
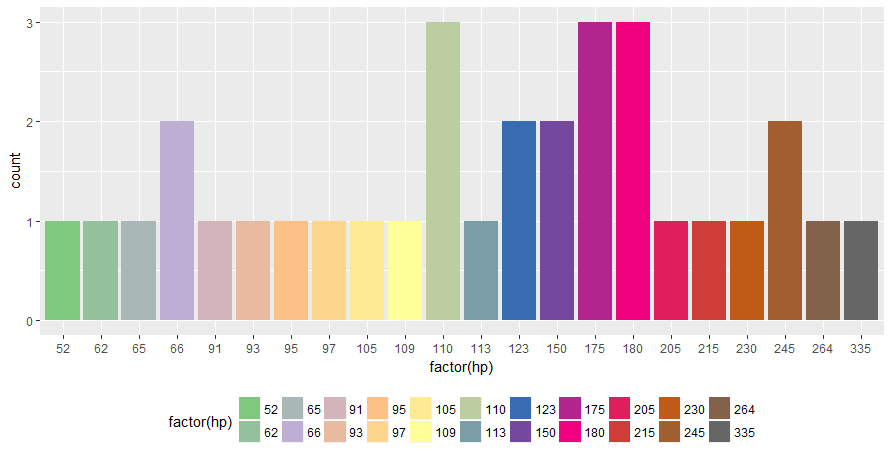
好奇的读者可能注意到如果柱状图包含 13 或者更多的柱子,我们可能会有下面的图中的麻烦:
ggplot(mtcars) +
  geom_bar(aes(factor(hp), fill=factor(hp))) +
  scale_fill_brewer(palette="Set2")
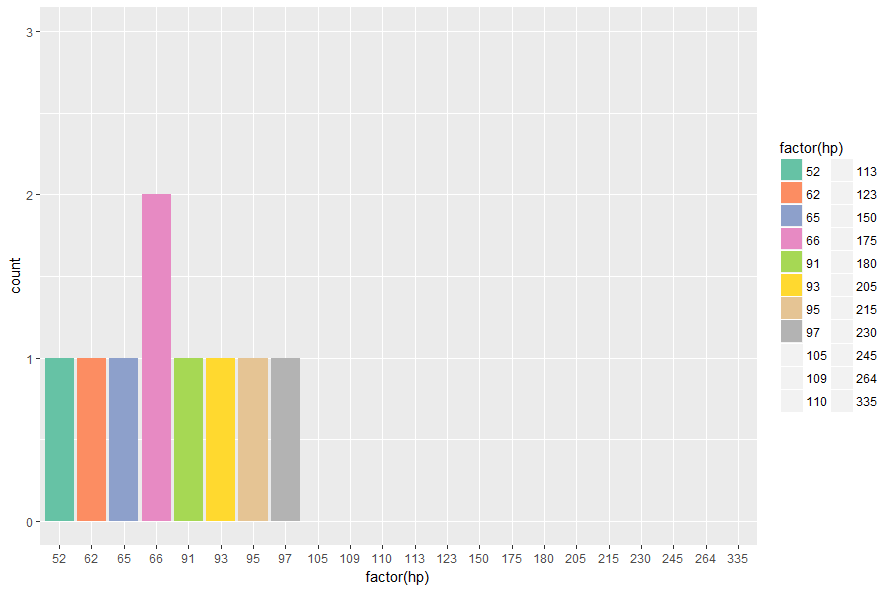
的确, length(unique(mtcars$hp)) 有 22 个唯一值,然而调色板 Set2 只有 8 中颜色。调色板中的颜色缺乏导致了 ggplot 如下的警告:
Warning message:
In RColorBrewer::brewer.pal(n, pal) : n too large, allowed maximum for palette Set2 is 8
Returning the palette you asked for with that many colors
RColorBrewer 为我们提供了一种通过使用构造函数 colorRampPalette 插入现有调色板来生成更大调色板的方法。它生成实际工作的函数:它们通过插入现有的调色板来构建具有任意数量颜色的调色板。要将调色板 Set1 插入到 22 种颜色(颜色数量存储在 colourCount 变量中,以供后续示例):
library(RColorBrewer)

colourCount = length(unique(mtcars$hp))
getPalette = colorRampPalette(brewer.pal(9, "Set1"))

ggplot(mtcars) +
  geom_bar(aes(factor(hp)), fill=getPalette(colourCount)) +
  theme(legend.position="right")
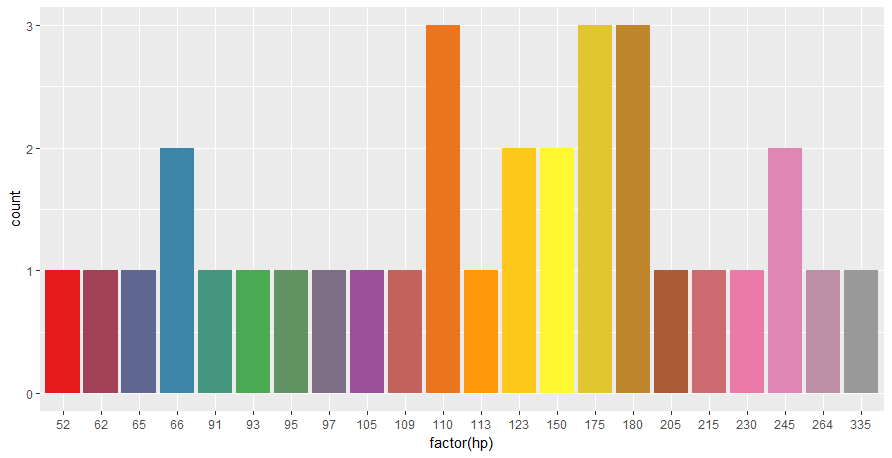
虽然我们解决了颜色不足的问题,但是其他有趣的事情发生了:虽然所有的柱子都回来了并且涂上了不同颜色,但是我们也失去了颜色图例。我故意添加主题(legend.position = ...)来展示这个事实:尽管有明确的位置请求,但图例不再是图形的一部分。
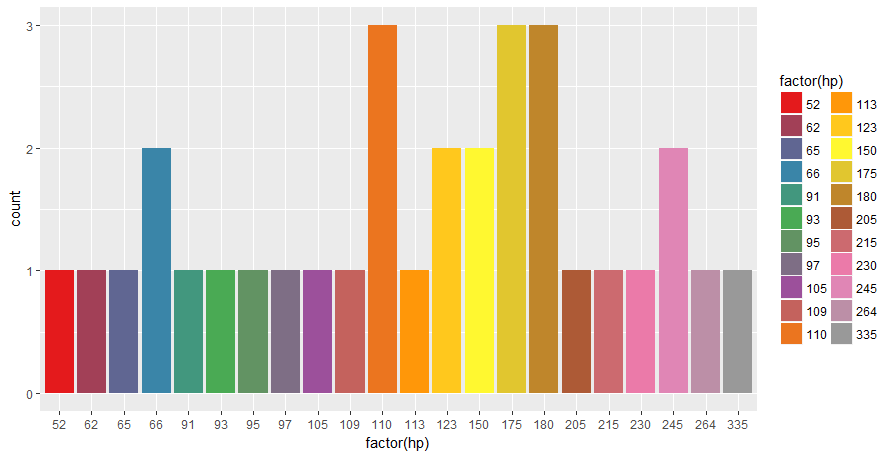
差异:fill 参数移动到柱状图 aes 函数之外 - 这有效地从 ggplot 的美学数据集中删除了 fill 信息。因此,legend 没有应用到任何东西上。要修复它,请将 fill 放回到 aes 中并使用 scale_fill_manual() 定义自定义调色板:
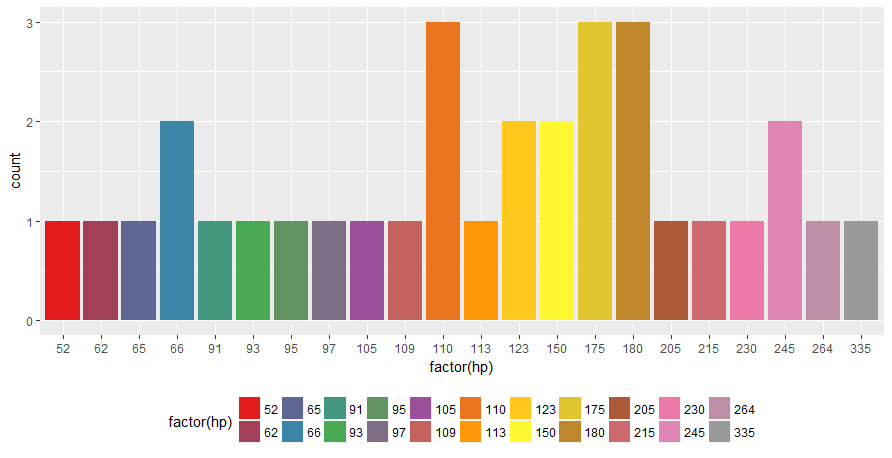
ggplot(mtcars) +
  geom_bar(aes(factor(hp), fill=factor(hp))) +
  scale_fill_manual(values = getPalette(colourCount))
在有大量柱子的柱状图中另一个可能的问题是 legend 的安放。用 theme 和 guides 来调整 legend 的位置和布局:
ggplot(mtcars) +
  geom_bar(aes(factor(hp), fill=factor(hp))) +
  scale_fill_manual(values = getPalette(colourCount)) +
  theme(legend.position="bottom") +
  guides(fill=guide_legend(nrow=2))
最后,在同一个例子中使用不同库调色板的调色板构造函数:
ggplot(mtcars) +
  geom_bar(aes(factor(hp), fill=factor(hp))) +
  scale_fill_manual(values = colorRampPalette(brewer.pal(12, "Accent"))(colourCount)) +
  theme(legend.position="bottom") +
  guides(fill=guide_legend(nrow=2))