1、示例1
代码
import numpy as npimport matplotlib.pyplot as plt
# 生成数据
np.random.seed(42)
v = np.random.normal(0, 1, 500)
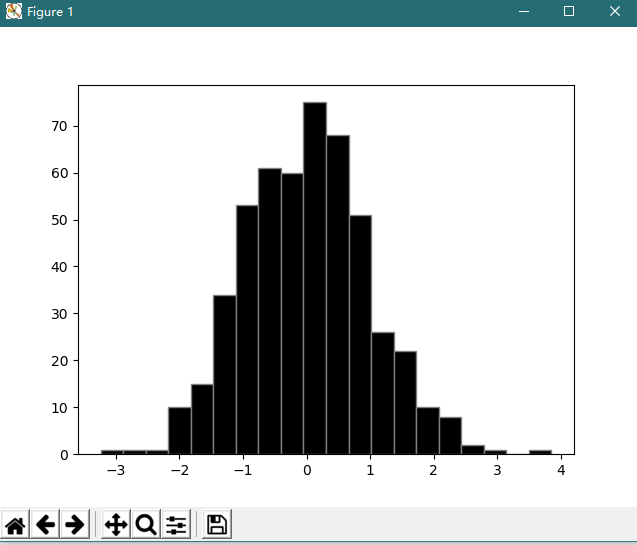
plt.hist(x = v, bins=20, color='k', edgecolor='gray')
plt.show()
图形
2、示例2
代码
import numpy as np
import pandas as pd
import matplotlib.pyplot as plt
# 生成数据
np.random.seed(42)
v = np.random.normal(0, 1, 500)
x = pd.DataFrame(v)
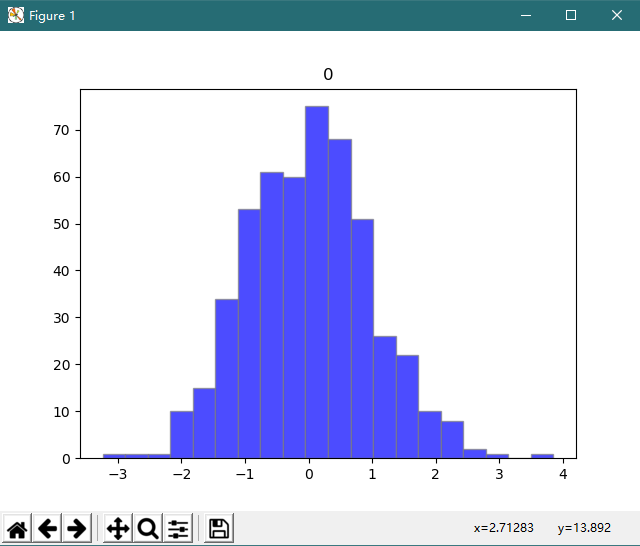
x.hist(bins=20, color = 'b', edgecolor = 'gray', alpha = 0.7, grid = False)
plt.show()
图形
。。。