1、误差条图
代码
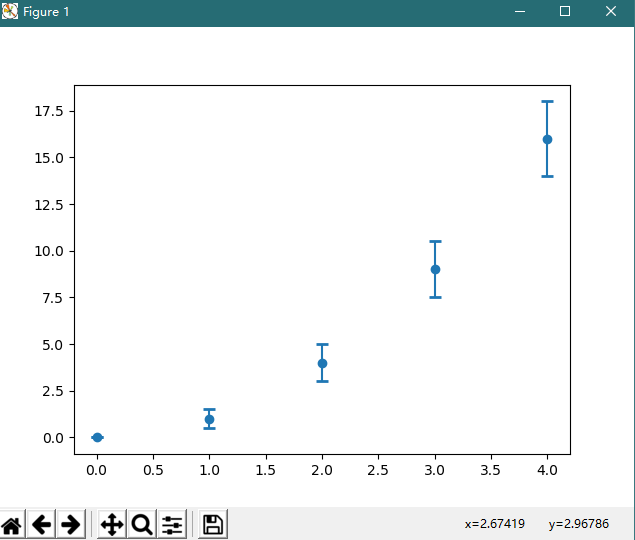
import numpy as np
import pandas as pd
import matplotlib.pyplot as plt

# 生成数据
x= pd.Series(range(5))
y = v.index ** 2
xe = x.index/2

plt.errorbar(x, y, yerr = xe, fmt='o', capsize=4, capthick=2)

plt.show()
图形
2、误差条形图
代码
import numpy as np
import matplotlib.pyplot as plt

# 生成数据
np.random.seed(42)

x = np.linspace(0, 13, 12)
y = np.log(x)
x_err = np.random.rand(len(x)) * 0.2

plt.bar(x, y, yerr = x_err, ecolor='r')

plt.show()
图形

。。。