1、普通风格
代码
import numpy as np
import matplotlib.pyplot as plt

rng = np.random.RandomState(27)
x = rng.normal(0, 1, 1000)

plt.hist(x, bins=9)

plt.show()
图形

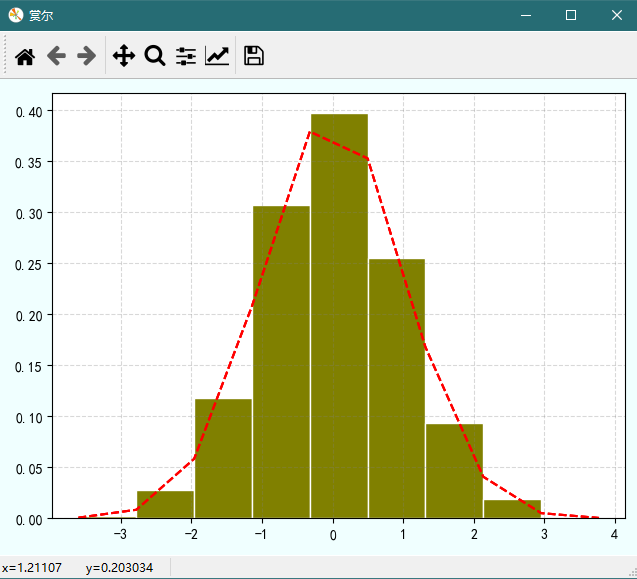
2 定制风格
代码
import numpy as np
import matplotlib.pyplot as plt
from scipy.stats import norm

rng = np.random.RandomState(27)
x = rng.normal(0, 1, 10000)

plt.figure('赏尔', facecolor='azure')

n, bins, patches = plt.hist(x, bins=9, density=True, color='olive',
                            ec='w', align='mid' )

y = norm.pdf(bins, 0, 1)#拟合一条最佳正态分布曲线y
plt.plot(bins, y, 'r--')
plt.grid(which='both', ls='--', c='gray', alpha=0.3 )
plt.tight_layout()

plt.show()
图形
。。。