观察从标准正态分布随机抽取的 100 个样本的 25 个分布。
Python 代码
import numpy as np
import matplotlib.pyplot as plt

fig, axes = plt.subplots(5, 5)

# 生成数据,绘制分布图形
for i, ax in enumerate(axes.ravel()) :
    rng = np.random.RandomState(i)
    x = rng.randn(100)
    ax.hist(x)

plt.show()
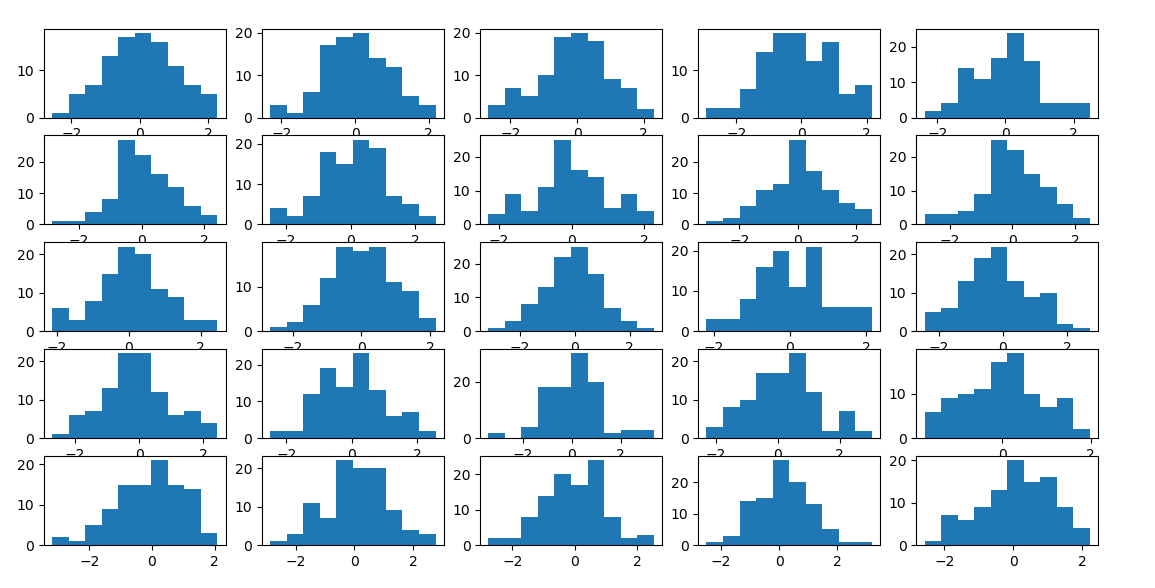
按语:
对于小样本量,样本分布的变异程度越大。