我们用的是阿里云托管的K8S集群1.21版本,用的 kube-prometheus 0.9 版本,如果你也是用的阿里云托管的ACK,提前提工单打开授权管理,不然安装的时候会找不到RoleBinding。
参考文档:
http://www.servicemesher.com/blog/prometheus-operator-manual/
https://github.com/coreos/prometheus-operator
https://github.com/coreos/kube-prometheus
https://www.cnblogs.com/twobrother/p/11165417.html
1、概述
1.1在k8s中部署Prometheus监控的方法
通常在k8s中部署prometheus监控可以采取的方法有以下三种
- 通过yaml手动部署
- operator部署
- 通过helm chart部署
1.2 什么是Prometheus Operator
Prometheus Operator的本职就是一组用户自定义的CRD资源以及Controller的实现,Prometheus Operator负责监听这些自定义资源的变化,并且根据这些资源的定义自动化的完成如Prometheus Server自身以及配置的自动化管理工作。以下是Prometheus Operator的架构图:
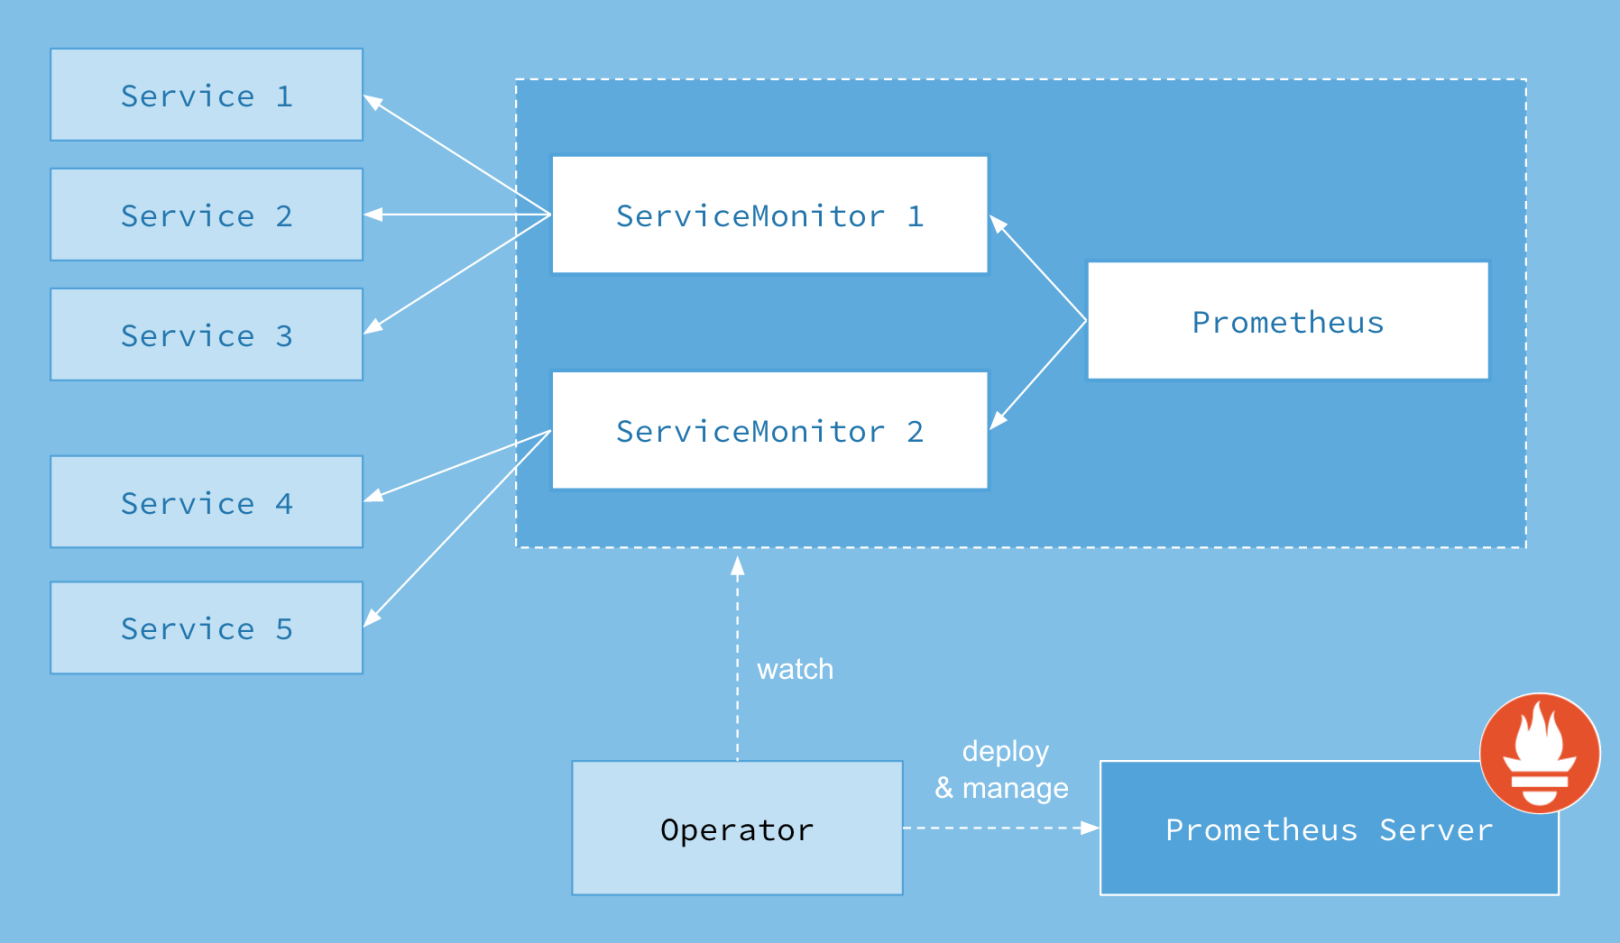
在配置prometheus-operator 监控jvm之前,我们必须要了解prometheus-operator的4个crd组件,这四个CRD作用如下:
Prometheus: 由 Operator 依据一个自定义资源kind: Prometheus类型中,所描述的内容而部署的 Prometheus Server 集群,可以将这个自定义资源看作是一种特别用来管理Prometheus Server的StatefulSets资源。
ServiceMonitor: 一个Kubernetes自定义资源(和kind: Prometheus一样是CRD),该资源描述了Prometheus Server的Target列表,Operator 会监听这个资源的变化来动态的更新Prometheus Server的Scrape targets并让prometheus server去reload配置(prometheus有对应reload的http接口/-/reload)。而该资源主要通过Selector来依据 Labels 选取对应的Service的endpoints,并让 Prometheus Server 通过 Service 进行拉取(拉)指标资料(也就是metrics信息),metrics信息要在http的url输出符合metrics格式的信息,ServiceMonitor也可以定义目标的metrics的url.
Alertmanager:Prometheus Operator 不只是提供 Prometheus Server 管理与部署,也包含了 AlertManager,并且一样通过一个 kind: Alertmanager 自定义资源来描述信息,再由 Operator 依据描述内容部署 Alertmanager 集群。
PrometheusRule:对于Prometheus而言,在原生的管理方式上,我们需要手动创建Prometheus的告警文件,并且通过在Prometheus配置中声明式的加载。而在Prometheus Operator模式中,告警规则也编程一个通过Kubernetes API 声明式创建的一个资源.告警规则创建成功后,通过在Prometheus中使用想servicemonitor那样用ruleSelector通过label匹配选择需要关联的PrometheusRule即可。
2.安装部署
1.下载部署包
wget -c https://github.com/prometheus-operator/kube-prometheus/archive/v0.7.0.zip
2.修改文件
其中kubelet的metrics采集端口,10250是https的,10255是http的
kube-scheduler的metrics采集端,10259是https的,10251是http的
Kube-controller的metrics采集端,10257是https的,10252是http的
测试:在主机上curl相关端口/metrics,即可获取相关metrics,如获取kubelet相关指标只需curl http://127.0.0.1:10255/metrics即可
-
kubernetes-serviceMonitorKubeScheduler.yaml
-
kubernetes-serviceMonitorKubeControllerManager.yaml
-
kubernetes-serviceMonitorKubelet.yaml
Yaml文件中相关信息采集默认采用https的端口,即10250端口,这样我们需要将port的端口改为http-metrics,同样的scheme改为http
参考:https://www.cnblogs.com/xinbat/p/15116903.html
3.部署
# cd kube-prometheus\manifests\setup
# kubectl apply .
# cd kube-prometheus\manifests\
# kubectl apply .
为prometheus、grafana、alertmanager 创建 ingress:
apiVersion: extensions/v1beta1
kind: Ingress
metadata:
  name: prometheus-alertmangaer-grafana-ingress
  namespace: monitoring
  annotations:
    nginx.ingress.kubernetes.io/rewrite-target: /
    nginx.ingress.kubernetes.io/ssl-redirect: 'true'
    nginx.ingress.kubernetes.io/proxy-connect-timeout: "600"
    nginx.ingress.kubernetes.io/proxy-read-timeout: "600"
    nginx.ingress.kubernetes.io/proxy-send-timeout: "600"
    nginx.ingress.kubernetes.io/connection-proxy-header: "keep-alive"
    nginx.ingress.kubernetes.io/proxy-http-version: "1.1"
    nginx.ingress.kubernetes.io/proxy-body-size: 80m
spec:
  tls:
  - hosts:
    - 'prometheus.xxx.com'
    secretName: xxx-com-secret
  - hosts:
    - 'grafana.xxx.com'
    secretName: xxx-com-secret
  - hosts:
    - 'alertmanager.xxx.com'
    secretName: xxx-com-secret
  rules:
  - host: prometheus.xxx.com
    http:
      paths:
      - path: /
        backend:
          serviceName: prometheus-k8s
          servicePort: 9090
  - host: grafana.xxx.com
    http:
      paths:
      - path: /
        backend:
          serviceName: grafana
          servicePort: 3000
  - host: alertmanager.xxx.com
    http:
      paths:
      - path: /
        backend:
          serviceName: alertmanager-main
          servicePort: 9093
解决Watchdog、ControllerManager、Scheduler监控问题
Watchdog是一个正常的报警,这个告警的作用是:如果alermanger或者prometheus本身挂掉了就发不出告警了,因此一般会采用另一个监控来监控prometheus,或者自定义一个持续不断的告警通知,哪一天这个告警通知不发了,说明监控出现问题了。prometheus operator已经考虑了这一点,本身携带一个watchdog,作为对自身的监控。
如果需要关闭,删除或注释掉Watchdog部分
prometheus-rules.yaml

...
  - name: general.rules
    rules:
    - alert: TargetDown
      annotations:
        message: 'xxx'
      expr: 100 * (count(up == 0) BY (job, namespace, service) / count(up) BY (job, namespace, service)) > 10
      for: 10m
      labels:
        severity: warning
#    - alert: Watchdog
#      annotations:
#        message: |
#          This is an alert meant to ensure that the entire alerting pipeline is functional.
#          This alert is always firing, therefore it should always be firing in Alertmanager
#          and always fire against a receiver. There are integrations with various notification
#          mechanisms that send a notification when this alert is not firing. For example the
#          "DeadMansSnitch" integration in PagerDuty.
#      expr: vector(1)
#      labels:
#        severity: none
对应的Watchdog的ServiceMonitor也可以删除。
KubeControllerManagerDown、KubeSchedulerDown的解决
原因是因为在prometheus-serviceMonitorKubeControllerManager.yaml中有如下内容,但默认安装的集群并没有给系统kube-controller-manager组件创建svc
  selector:
    matchLabels:
      k8s-app: kube-controller-manager
修改kube-controller-manager的监听地址:
# vim /etc/kubernetes/manifests/kube-controller-manager.yaml
...
spec:
  containers:
  - command:
    - kube-controller-manager
    - --allocate-node-cidrs=true
    - --authentication-kubeconfig=/etc/kubernetes/controller-manager.conf
    - --authorization-kubeconfig=/etc/kubernetes/controller-manager.conf
    - --bind-address=0.0.0.0


# netstat -lntup|grep kube-contro
tcp6       0      0 :::10257                :::*                    LISTEN      38818/kube-controll
创建
prometheus-kube-controller-manager-service.yaml
prometheus-kube-scheduler-service.yaml,以便serviceMonitor监听
# cat  prometheus-kube-controller-manager-service.yaml
apiVersion: v1
kind: Service
metadata:
  namespace: kube-system
  name: kube-controller-manager
  labels:
    k8s-app: kube-controller-manager
spec:
  selector:
    component: kube-controller-manager
  ports:
  - name: http-metrics
    port: 10252
    targetPort: 10252
    protocol: TCP
# cat  prometheus-kube-scheduler-service.yaml
apiVersion: v1
kind: Service
metadata:
  namespace: kube-system
  name: kube-scheduler
  labels:
    k8s-app: kube-scheduler
spec:
  selector:
    component: kube-scheduler
  ports:
  - name: http-metrics
    port: 10251
    targetPort: 10251
    protocol: TCP
#10251是kube-scheduler组件 metrics 数据所在的端口,10252是kube-controller-manager组件的监控数据所在端口。
上面 labels 和 selector 部分,labels 区域的配置必须和我们上面的 ServiceMonitor 对象中的 selector 保持一致,selector下面配置的是component=kube-scheduler,为什么会是这个 label 标签呢,我们可以去 describe 下 kube-scheduelr 这个 Pod
#  kubectl describe pod kube-scheduler-k8s-master -n kube-system
Name:                 kube-scheduler-k8s-master
Namespace:            kube-system
Priority:             2000000000
Priority Class Name:  system-cluster-critical
Node:                 k8s-master/10.6.76.25
Start Time:           Thu, 29 Aug 2019 09:21:01 +0800
Labels:               component=kube-scheduler
                      tier=control-plane

#  kubectl describe pod kube-controller-manager-k8s-master -n kube-system
Name:                 kube-controller-manager-k8s-master
Namespace:            kube-system
Priority:             2000000000
Priority Class Name:  system-cluster-critical
Node:                 k8s-master/10.6.76.25
Start Time:           Thu, 29 Aug 2019 09:21:01 +0800
Labels:               component=kube-controller-manager
                      tier=control-plane
浏览器ingress方式访问
https://prometheus.xxx.com/
https://alertmanager.xxx.com/
https://grafana.xxx.com/
grafana默认账号密码admin admin需要重置密码进入
参考:
https://www.cnblogs.com/huss2016/p/14865316.html
http://t.zoukankan.com/ssgeek-p-14441149.html
https://www.cnblogs.com/xinbat/p/15116903.html
https://www.cnblogs.com/zhangrui153169/p/13609172.html
https://blog.csdn.net/twingao/article/details/105261641
https://www.cnblogs.com/twobrother/p/11165417.html
https://blog.csdn.net/qq_43164571/article/details/119990724
https://www.kococ.cn/20210302/cid=697.html