首先来看看Path的定义,参考MSDN:绘制一系列相互连接的直线和曲线。介绍比较简单,我们再来看看备注中有些什么,Path 对象可以绘制封闭式还是开放式形状、 多个形状和甚至曲线的形状。与不 Line 和 Polyline 对象,可以使用此对象来绘制曲线。 请参阅 Data 属性有关的形状的说明, Path 元素支持。
我们来看看Path的继承关系,以至于对其有一个大概的概念和理解。
System.Object
System.Windows.Threading.DispatcherObject
System.Windows.DependencyObject
System.Windows.Media.Visual
System.Windows.UIElement
System.Windows.FrameworkElement
System.Windows.Shapes.Shape
System.Windows.Shapes.Path
直接的继承关系是System.Windows.Shapes.Shape,用过的人应该对Shape不会陌生,Rectangle、Ellipse、Line、Polyline、Polygon,而且这些中功能最强大的要属Path了,所有其他Shape具备的功能Path都具备,而且还可以做更多的事情,你甚至只使用Path就足以完成矢量绘图,但是Path的不足就是使用过于繁琐,Path自己唯一定义的属性是Data,为Geometry类型的对象。
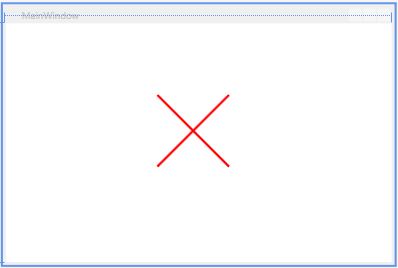
1 使用Path绘制直线。
  <Canvas>
        <Path Fill="Blue" Stroke="Red" StrokeThickness="3">
            <Path.Data>
                <LineGeometry StartPoint="96 96" EndPoint="192 192">    </LineGeometry>
            </Path.Data>
        </Path>
            <Path Fill="Blue" Stroke="Red" StrokeThickness="3">
                <Path.Data>
                    <LineGeometry StartPoint="192 96" EndPoint="96 192"></LineGeometry>
                </Path.Data>
            </Path>
   </Canvas>
显示的结果为:两条相交的直线。
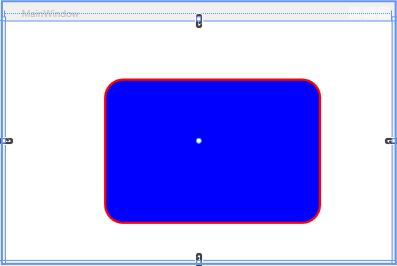
2 使用Path绘制Rectangle。
       <Canvas HorizontalAlignment="Center" Width="245" Margin="107,0,165,0">
            <Path Fill="Blue" Stroke="Red" StrokeThickness="3" Canvas.Left="-69.732" Canvas.Top="29.501">
                <Path.Data>
                        <RectangleGeometry Rect="96 48 288 192" RadiusX="24" RadiusY="24"></RectangleGeometry>
                    </Path.Data>
            </Path>
        </Canvas>
这里面RadiusX和RadiusY用来指定拐角的曲率。
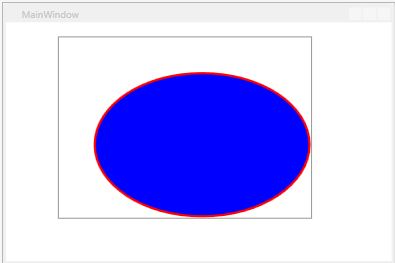
3 使用Path绘制Ellipse。
   <Canvas HorizontalAlignment="Center" Width="245" Margin="141,-10,131,10">
            <Path Fill="Blue" Stroke="Red" StrokeThickness="3" Canvas.Left="-69.732" Canvas.Top="29.501">
                <Path.Data>
                    <EllipseGeometry Center="192 144" RadiusX="144" RadiusY="96"></EllipseGeometry>
                </Path.Data>
            </Path>
   </Canvas>
绘制的椭圆如下,这里需要提醒的是当RadiusX=RadiusY,绘制的是一个圆形。
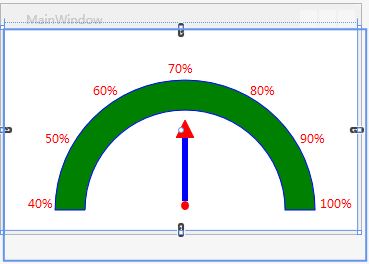
4 Path绘制自定义图形。
<Canvas Width="360" Height="230" >
            <Path Stroke="Blue" Fill="Green">
                <Path.Data>
                    <PathGeometry>
                        <PathFigure StartPoint="80,180">
                            <LineSegment Point="50,180" ></LineSegment>
                            <ArcSegment Point="310,180" Size="130,130"  SweepDirection="Clockwise" />
                            <LineSegment Point="280,180" ></LineSegment>
                            <ArcSegment Point="80,180" Size="100,100" SweepDirection="Counterclockwise" />
                        </PathFigure>
                    </PathGeometry>
                </Path.Data>

            </Path>
            <StackPanel Orientation="Vertical"  Canvas.Left="171" Canvas.Top="90"  Width="18" Height="90">
                <Path  Stroke="Red" StrokeDashCap="Triangle" StrokeThickness="1" Fill="Red" >
                    <Path.Data>
                        <PathGeometry Figures="M 0,18 L 18,18 9,0 Z"></PathGeometry>
                    </Path.Data>
                </Path>
                <Rectangle   Fill="Blue" Height="63" Width="6">
                </Rectangle>
                <Ellipse Fill="Red" Width="8" Height="9" HorizontalAlignment="Center" Margin="3,0,3,0"></Ellipse>

            </StackPanel>
            <Label Content="40%" Foreground="Red" Canvas.Left="18" Canvas.Top="160"></Label>
            <Label Content="50%" Foreground="Red" Canvas.Left="35.42" Canvas.Top="95"></Label>
            <Label Content="60%" Foreground="Red" Canvas.Left="83" Canvas.Top="47.42"></Label>
            <Label Content="70%" Foreground="Red" Canvas.Left="158" Canvas.Top="25"></Label>
            <Label Content="80%" Foreground="Red" Canvas.Left="240" Canvas.Top="47.42"></Label>
            <Label Content="90%" Foreground="Red" Canvas.Left="290" Canvas.Top="95"></Label>
            <Label Content="100%" Foreground="Red" Canvas.Left="310" Canvas.Top="160"></Label>
        </Canvas>
这里使用一个稍微复杂一些的仪表盘作为示例,介绍怎么使用PathGeometry,我们来看看绘制出来的结果。
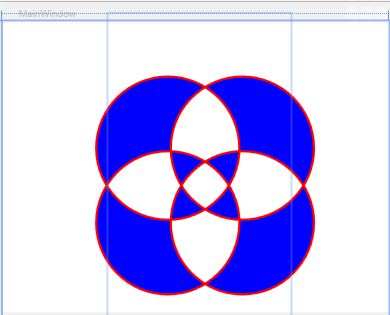
5 Path使用GeometryGroup来组合图形。
<Canvas HorizontalAlignment="Center" Width="245" Margin="141,-10,131,10">
            <Path Fill="Blue" Stroke="Red" StrokeThickness="3" Canvas.Left="-69.732" Canvas.Top="29.501">
                <Path.Data>
                    <GeometryGroup>
                        <EllipseGeometry Center="150 150" RadiusX="96" RadiusY="96"></EllipseGeometry>
                        <EllipseGeometry Center="250 150" RadiusX="96" RadiusY="96"></EllipseGeometry>
                        <EllipseGeometry Center="150 250" RadiusX="96" RadiusY="96"></EllipseGeometry>
                        <EllipseGeometry Center="250 250" RadiusX="96" RadiusY="96"></EllipseGeometry>
                    </GeometryGroup>
                </Path.Data>
            </Path>
        </Canvas>
我们来看看结果。
本节就介绍这么多,后续的文章中会陆续介绍更加重要的如何使用CombineGeometry来进行几何图形的组合,未完待续......