用vis.js库实现Neo4j的可视化
vis.js简介
功能需求
实现步骤
1. 获取查询结果
2. 转换数据格式
3. 指定绘图容器
4. 配置绘图参数
5. 绘图实例参考
最终结果
总结
vis.js简介
vis.js是一个基于浏览器的动态可视化库,这个可视化库易于上手使用,而且可以处理高量级的动态数据,并且能够与数据进行交互。
vis.js由五部分组成:
DataSet
Timeline
Network
Graph2d
Graph3d
功能需求
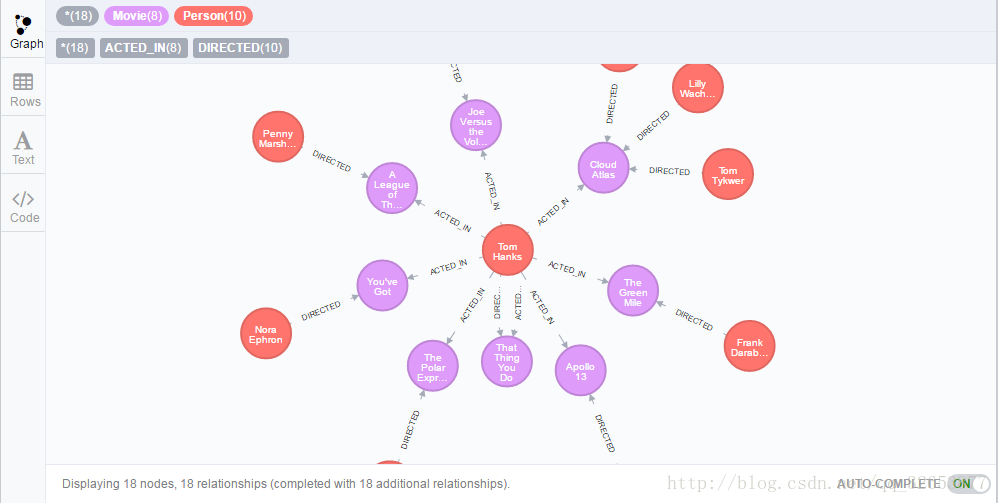
模仿Neo4j Community Edition上查询结果展示的结果,将neo4j的查询结果可视化。
实现步骤
1. 获取查询结果
将查询语句传给服务器,并将查询结果存到特定格式的JSON格式
/*
nodes:id,label,properties
edges:id,source,target,title
*/
data = {
nodes: nodes,
edges: edges
};
2. 转换数据格式
在Neo4j中以label来分类,但vis.js中如果想要实现分类(如不同类别的节点分别绘不同颜色)就得以group来实现分类。所以需要写一个函数来转换一下数据,将label转换为group,把一个property赋给label。
for (index in inputJsonData.nodes) {
var node = {};
node.id = inputJsonData.nodes[index]['id'];
node.label = inputJsonData.nodes[index]['title'];
node.group = inputJsonData.nodes[index]['label'];
nodes[node.id] = node;
}
3. 指定绘图容器
graph = new vis.Graph(graph_container, data, options);
将绘图函数中的绘图容器参数graph_container赋为要展示的页面div。
4. 配置绘图参数
可以设置绘图函数的节点、边、分组、布局、交互等参数,来实现不同的绘图需求。
var options = {
autoResize: true,
height: '100%',
'100%'
locale: 'en',
locales: locales,
clickToUse: false,
configure: {...}, // defined in the configure module.
edges: {...}, // defined in the edges module.
nodes: {...}, // defined in the nodes module.
groups: {...}, // defined in the groups module.
layout: {...}, // defined in the layout module.
interaction: {...}, // defined in the interaction module.
manipulation: {...}, // defined in the manipulation module.
physics: {...}, // defined in the physics module.
}
具体绘图函数和参数可参考[这儿]
5. 绘图实例参考
vis.js官网上的绘图实例,更多绘图实例可以参考这儿
<html><head>
<title>Network | Basic usage</title>
<script type="text/javascript" src="../../dist/vis.js"></script>
<link href="../../dist/vis-network.min.css" rel="stylesheet" type="text/css">
<style type="text/css">
#mynetwork {
600px;
height: 400px;
border: 1px solid lightgray;
}
</style>
</head>
<body>
<p>
Create a simple network with some nodes and edges.
</p>
<div id="mynetwork"><div class="vis-network" tabindex="900" style="position: relative; overflow: hidden; touch-action: pan-y; user-select: none; -webkit-user-drag: none; -webkit-tap-highlight-color: rgba(0, 0, 0, 0); 100%; height: 100%;"><canvas width="600" height="400" style="position: relative; touch-action: none; user-select: none; -webkit-user-drag: none; -webkit-tap-highlight-color: rgba(0, 0, 0, 0); 100%; height: 100%;"></canvas></div></div>
<script type="text/javascript">
// create an array with nodes
var nodes = new vis.DataSet([
{id: 1, label: 'Node 1'},
{id: 2, label: 'Node 2'},
{id: 3, label: 'Node 3'},
{id: 4, label: 'Node 4'},
{id: 5, label: 'Node 5'}
]);
// create an array with edges
var edges = new vis.DataSet([
{from: 1, to: 3},
{from: 1, to: 2},
{from: 2, to: 4},
{from: 2, to: 5},
{from: 3, to: 3}
]);
// create a network
var container = document.getElementById('mynetwork');
var data = {
nodes: nodes,
edges: edges
};
var options = {};
var network = new vis.Network(container, data, options);
</script>
</body>
</html>
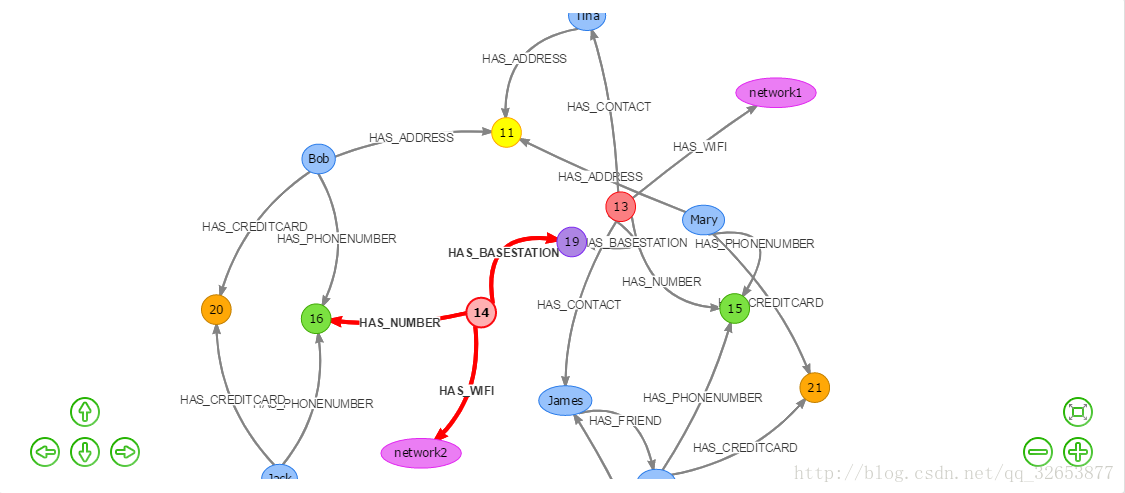
最终结果
总结
需要先获取查询结果,然后将查询结果存到一定格式的JSON,再经数据格式转换函数将数据转换成vis.js绘图函数需要的数据格式.
最后调整绘图参数以达到绘图需求。
————————————————
版权声明:本文为CSDN博主「翁松秀」的原创文章,遵循 CC 4.0 BY-SA 版权协议,转载请附上原文出处链接及本声明。
原文链接:https://blog.csdn.net/qq_32653877/article/details/71436301