安装
yum -y install httpd-tools
使用
[root@xxx ~]# ab
ab: wrong number of arguments
Usage: ab [options] [http[s]://]hostname[:port]/path
Options are:
    -n requests     Number of requests to perform
    -c concurrency  Number of multiple requests to make at a time
    -t timelimit    Seconds to max. to spend on benchmarking
                    This implies -n 50000
    -s timeout      Seconds to max. wait for each response
                    Default is 30 seconds
    -b windowsize   Size of TCP send/receive buffer, in bytes
    -B address      Address to bind to when making outgoing connections
    -p postfile     File containing data to POST. Remember also to set -T
    -u putfile      File containing data to PUT. Remember also to set -T
    -T content-type Content-type header to use for POST/PUT data, eg.
                    'application/x-www-form-urlencoded'
                    Default is 'text/plain'
    -v verbosity    How much troubleshooting info to print
    -w              Print out results in HTML tables
    -i              Use HEAD instead of GET
    -x attributes   String to insert as table attributes
    -y attributes   String to insert as tr attributes
    -z attributes   String to insert as td or th attributes
    -C attribute    Add cookie, eg. 'Apache=1234'. (repeatable)
    -H attribute    Add Arbitrary header line, eg. 'Accept-Encoding: gzip'
                    Inserted after all normal header lines. (repeatable)
    -A attribute    Add Basic WWW Authentication, the attributes
                    are a colon separated username and password.
    -P attribute    Add Basic Proxy Authentication, the attributes
                    are a colon separated username and password.
    -X proxy:port   Proxyserver and port number to use
    -V              Print version number and exit
    -k              Use HTTP KeepAlive feature
    -d              Do not show percentiles served table.
    -S              Do not show confidence estimators and warnings.
    -q              Do not show progress when doing more than 150 requests
    -g filename     Output collected data to gnuplot format file.
    -e filename     Output CSV file with percentages served
    -r              Don't exit on socket receive errors.
    -h              Display usage information (this message)
    -Z ciphersuite  Specify SSL/TLS cipher suite (See openssl ciphers)
    -f protocol     Specify SSL/TLS protocol
                    (SSL3, TLS1, TLS1.1, TLS1.2 or ALL)
[root@xxx ~]#
[root@xxx ~]#
[root@xxx ~]#
[root@xxx ~]# ab -V
This is ApacheBench, Version 2.3 <$Revision: 1430300 $>
Copyright 1996 Adam Twiss, Zeus Technology Ltd, http://www.zeustech.net/
Licensed to The Apache Software Foundation, http://www.apache.org/

[root@xxx ~]#
使用
[root@xxx ~]#
[root@xxx ~]# ab -n 100 -c 10 -w http://www.baidu.com/ >>miss.html
[root@xxx ~]#
查看结果
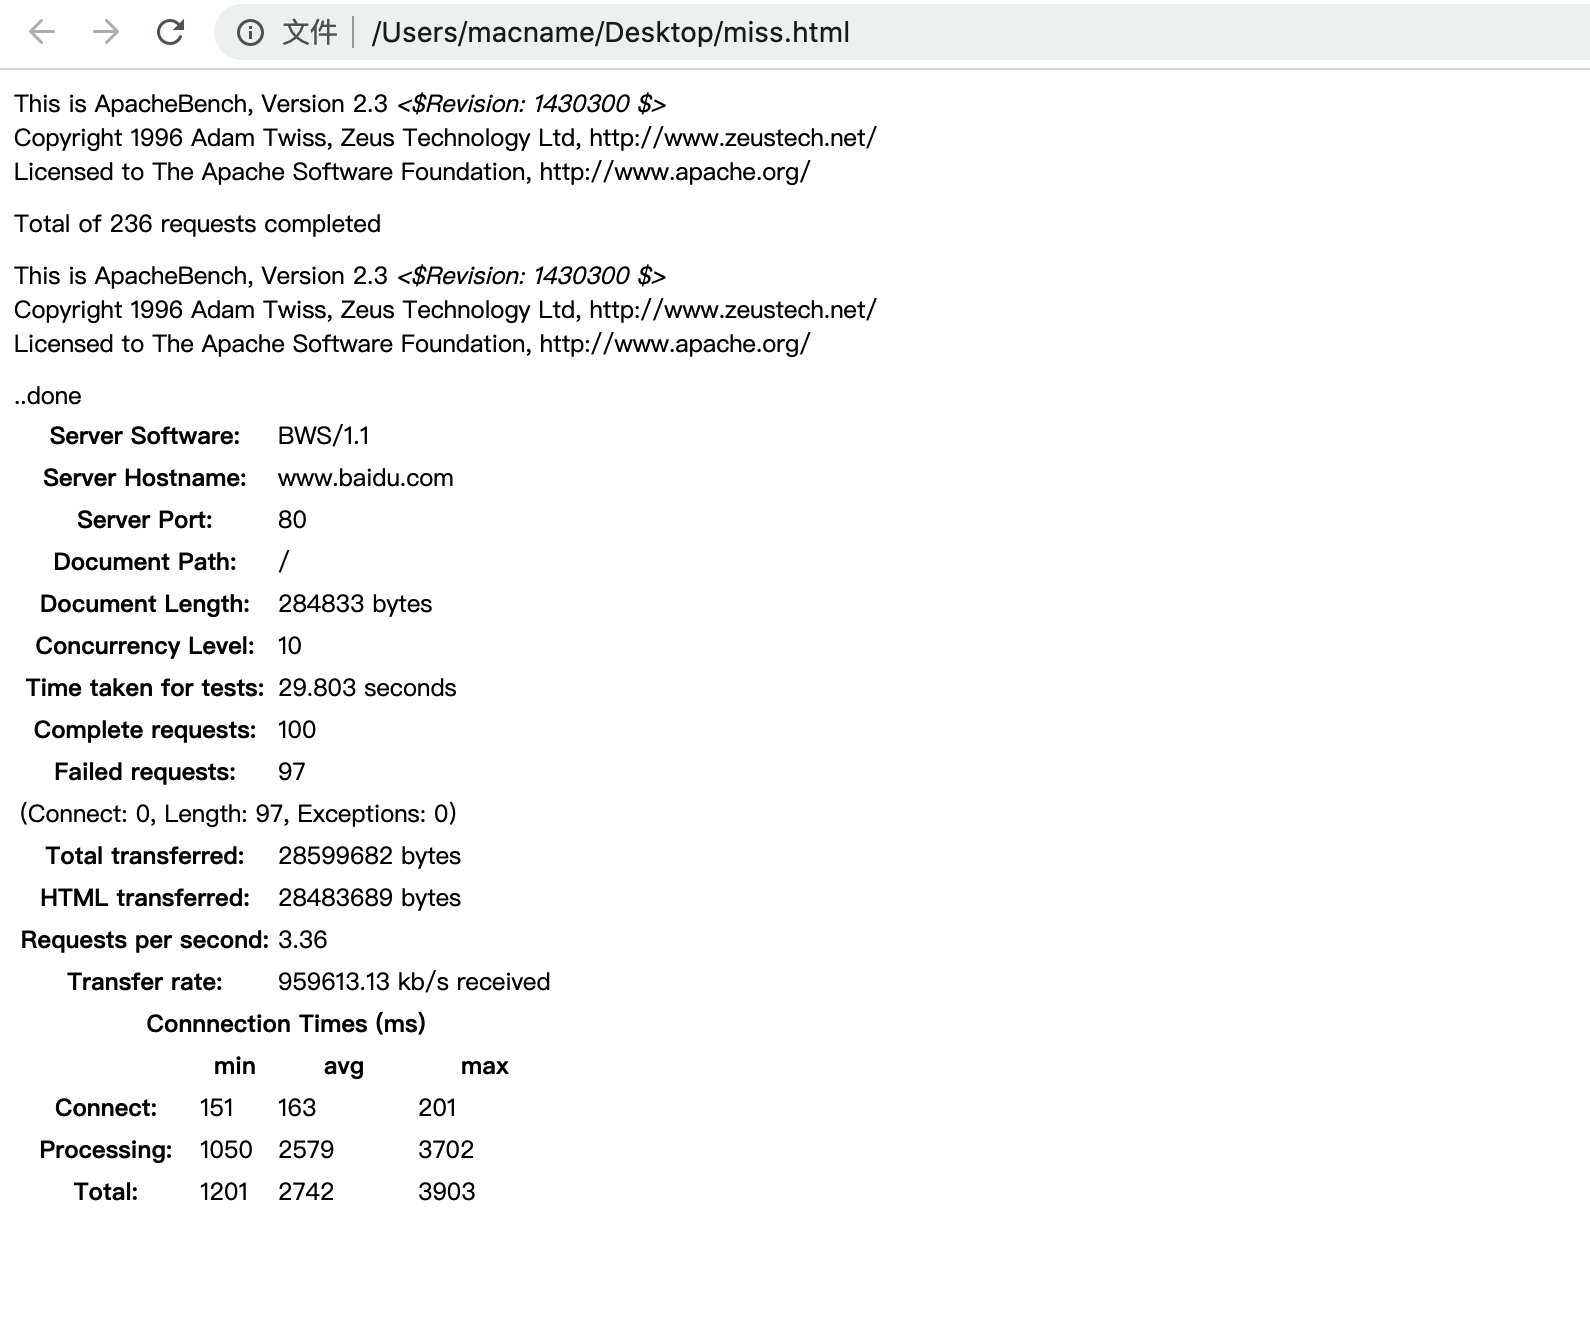
报告分析
This is ApacheBench, Version 2.3
Copyright 1996 Adam Twiss, Zeus Technology Ltd, http://www.zeustech.net/
Licensed to The Apache Software Foundation, http://www.apache.org/
Benchmarking 192.168.80.157 (be patient)
Completed 400 requests
Completed 800 requests
Completed 1200 requests
Completed 1600 requests
Completed 2000 requests
Completed 2400 requests
Completed 2800 requests
Completed 3200 requests
Completed 3600 requests
Completed 4000 requests
Finished 4000 requests
Server Software: Apache/2.2.15
Server Hostname: 192.168.80.157
Server Port: 80
Document Path: /phpinfo.php
#测试的页面
Document Length: 50797 bytes
#页面大小
Concurrency Level: 1000
#测试的并发数
Time taken for tests: 11.846 seconds
#整个测试持续的时间
Complete requests: 4000
#完成的请求数量
Failed requests: 0
#失败的请求数量
Write errors: 0
Total transferred: 204586997 bytes
#整个过程中的网络传输量
HTML transferred: 203479961 bytes
#整个过程中的HTML内容传输量
Requests per second: 337.67 [#/sec] (mean)
#最重要的指标之一,相当于LR中的每秒事务数,后面括号中的mean表示这是一个平均值
Time per request: 2961.449 [ms] (mean)
#最重要的指标之二,相当于LR中的平均事务响应时间,后面括号中的mean表示这是一个平均值
Time per request: 2.961 [ms] (mean, across all concurrent requests)
#每个连接请求实际运行时间的平均值
Transfer rate: 16866.07 [Kbytes/sec] received
#平均每秒网络上的流量,可以帮助排除是否存在网络流量过大导致响应时间延长的问题
Connection Times (ms)
min mean[+/-sd] median max
Connect: 0 483 1773.5 11 9052
Processing: 2 556 1459.1 255 11763
Waiting: 1 515 1459.8 220 11756
Total: 139 1039 2296.6 275 11843
#网络上消耗的时间的分解,各项数据的具体算法还不是很清楚
Percentage of the requests served within a certain time (ms)
50% 275
66% 298
75% 328
80% 373
90% 3260
95% 9075
98% 9267
99% 11713
100% 11843 (longest request)
#整个场景中所有请求的响应情况。在场景中每个请求都有一个响应时间,其中50%的用户响应时间小于275毫秒,66%的用户响应时间小于298毫秒,最大的响应时间小于11843毫秒。对于并发请求,cpu实际上并不是同时处理的,而是按照每个请求获得的时间片逐个轮转处理的,所以基本上第一个Time per request时间约等于第二个Time per request时间乘以并发请求数。