#coding=utf-8
import matplotlib.pyplot as plt
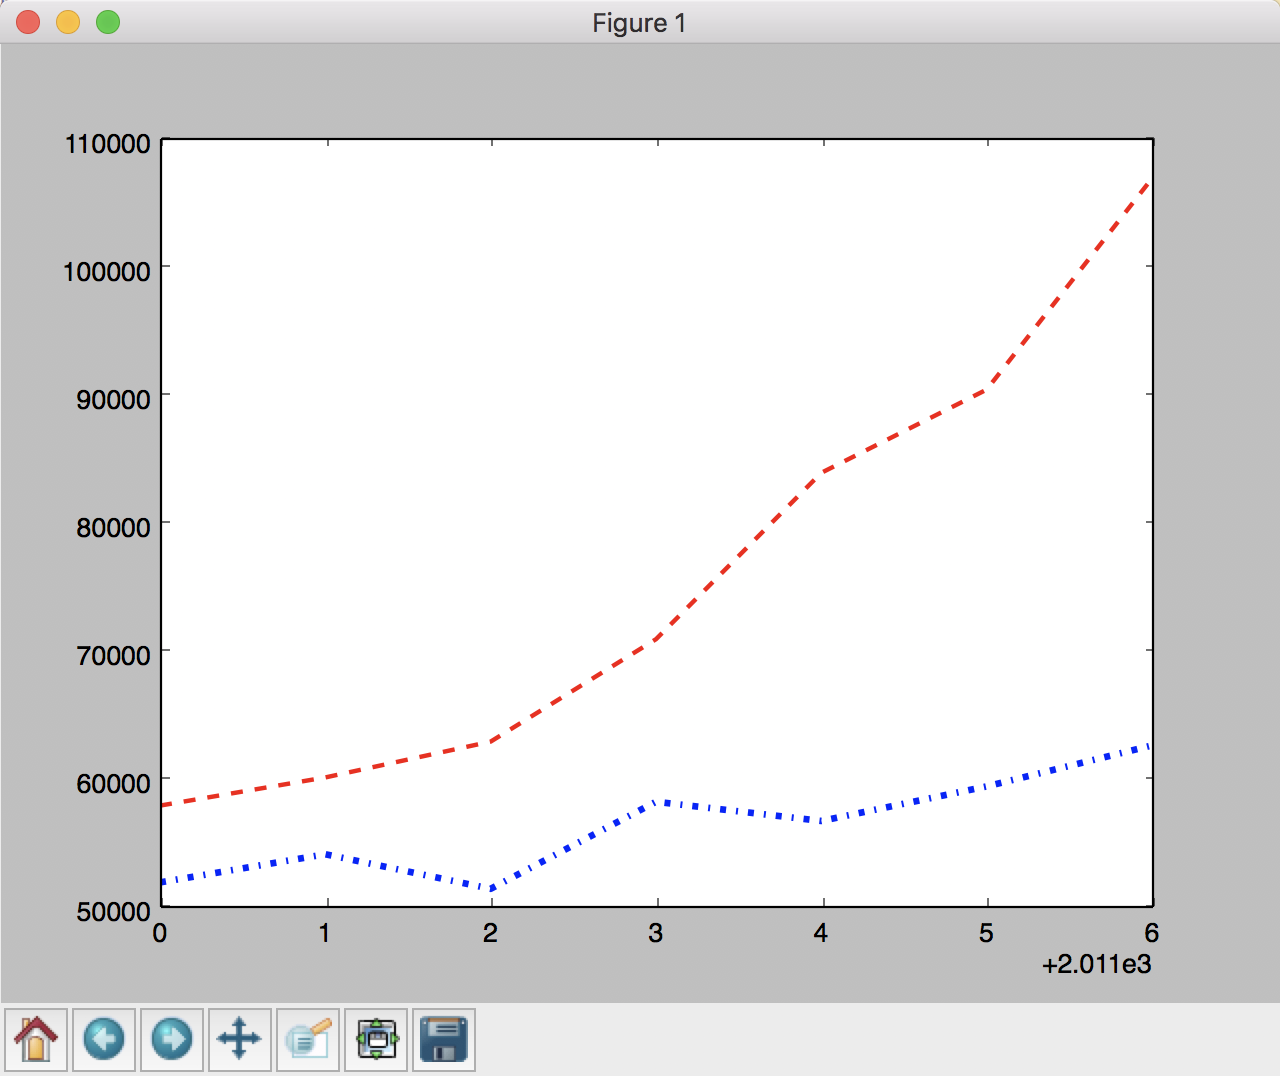
x_data = ['2011','2012','2013','2014','2015','2016','2017']
y_data = [58000,60200,63000,71000,84000,90500,107000]
y_data2 = [52000,54200,51500,58300,56800,59500,62700]
plt.plot(x_data,y_data,color='red',linewidth=2.0,linestyle='--')
plt.plot(x_data,y_data2,color='blue',linewidth=3.0,linestyle='-.')
plt.show()