Streamlit 是 Python 的一个用于创建 Web App 的框架,类似于 R 的 Shiny。其功能虽不如 R Shiny 强大,更不如专门的 Python Web 框架如 Flask、Djiango 等强大,但其使用非常直观和简单,不需要过多的 Web 知识。如果之前用过 Markdown 或 Jupyter Notebook 等,便能快速上手,创建自己的 Web App。
Streamlit 的使用场景,如:
- 研究开发了一个临床预测模型,使用 Streamlit 将该预测模型搭建在网站上随论文发表或供别人体检。
- 公司某部门人员需要批量处理 Excel 文件,因而可以写一个 python 脚本自动化处理;但部门人员并不会用 python、也未安装 python 环境,此时便可将该脚本使用 Streamlit 部署成 Web App,部门人员使用时只需点击上传 Excel 文件,然后点击下载处理完成的文件即可。
Streamlit 安装
pip install streamlit
Streamlit 自带示例 App
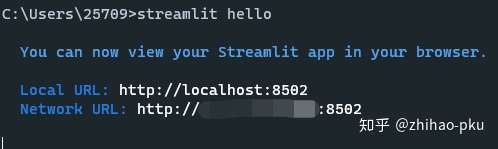
命令行中运行:streamlit hello,便可创建一个本地的 Web App,点击 URL 地址(http://localhost:8502)在浏览器打开。
可以看到几个 App 的 Demo,可分别点击查看:

创建自己的 App
Streamlit 写 App 就是创建一个 py 文件,而不需要分别创建前端和后端。一个示例 py 文件(example.py)如下:
import streamlit as st
import numpy as np
import pandas as pd
import matplotlib.pyplot as plt
# 展示文本;文本直接使用Markdown语法
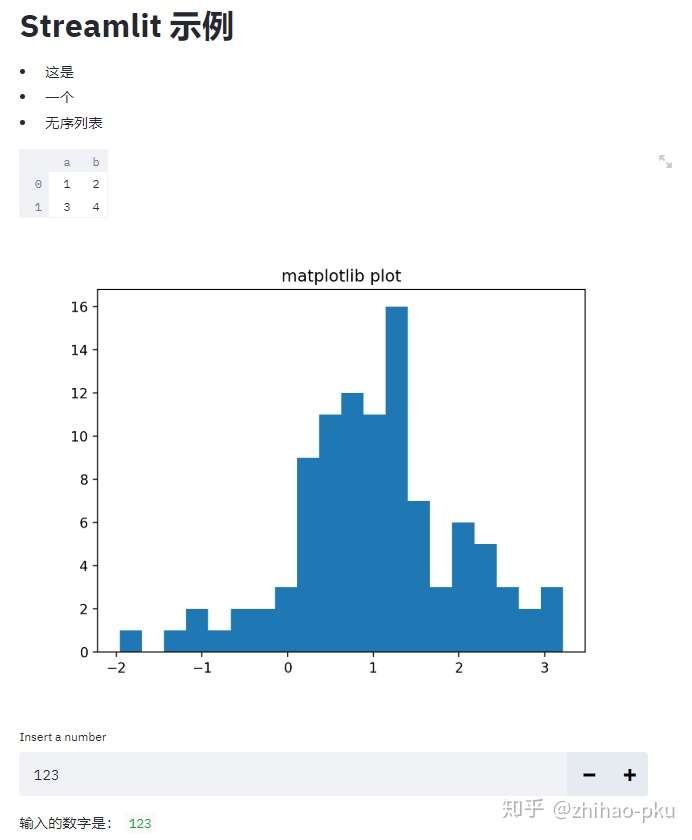
st.markdown("# Streamlit示例")
st.markdown("""
- 这是
- 一个
- 无序列表
""")
# 展示pandas数据框
st.dataframe(pd.DataFrame([[1, 2], [3, 4]], columns=["a", "b"]))
# 展示matplotlib绘图
arr = np.random.normal(1, 1, size=100)
plt.hist(arr, bins=20)
plt.title("matplotlib plot")
st.pyplot()
# 加入交互控件,如输入框
number = st.number_input("Insert a number", 123)
st.write("输入的数字是:", number)将该 py 文件放在某文件夹下,cmd 中 cd 到该文件夹,输入命令 streamlit run example.py,点击出现的 URL 后可见界面:
- 可以使用
streamlit run example.py --server.port 80指定 App 在 80 端口运行 - 上述方式将 App 搭建在本地机上,如果想将 App 供别人访问,则需将 App 搭建在服务器如阿里云服务器或者部署在托管网站如 heroku 再或者使用内网穿透软件如 花生壳。网上不少教程,可自行查阅~
Streamlit 主要用法总结
import streamlit as st
import pandas as pd
import numpy as np
import time
import matplotlib.pyplot as plt
import seaborn as sns
import plotly.figure_factory as ff
import altair as alt
from PIL import Image
import base64
文字、公式
对照输出查看显示效果
st.title("st.title")
st.header("st.header")
st.subheader("st.subheader")

st.markdown("# markdown一级标题")
st.markdown("## markdown二级标题")
st.markdown("### markdown三级标题")

# ------------------------------------

st.write("st.write")
st.markdown("markdown普通文字")
st.text("st.text")

# ------------------------------------

st.markdown("""
Markdown列表:
- hello
- world
- China
""")

st.markdown("***markdown粗斜体***")

# ------------------------------------

st.latex("\sum_{i=1}^{n}")

# ------------------------------------

st.write(1234)
st.write("1234")
st.write("1 + 1 = ", 2)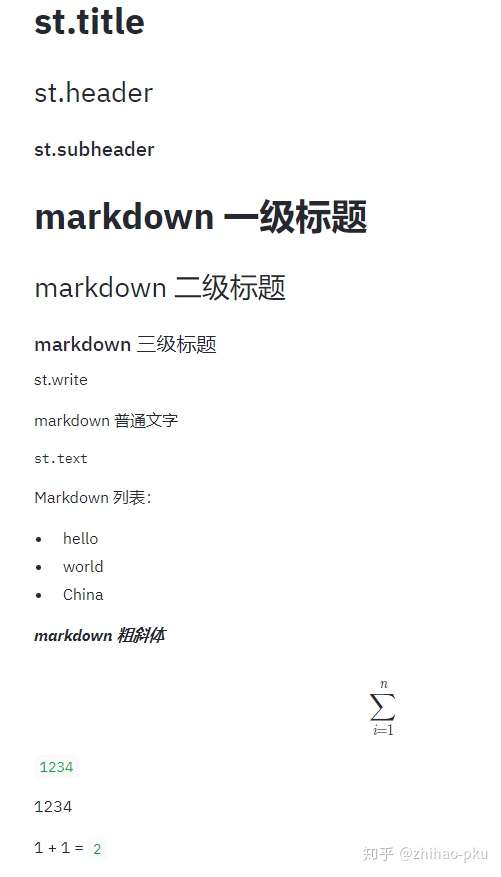
st.write()
st.write () 是一个泛型函数,根据传入对象不同采取不同的展示方式,比如传入 pandas.DataFrame 时,st.write (df) 默认调用 st.dataframe (),传入 markdown 时,st.write (markdown) 默认调用 st.markdown ();跟 R 的泛型函数非常类似。可传入的对象有:
- write(data_frame) : Displays the DataFrame as a table.
- write(func) : Displays information about a function.
- write(module) : Displays information about the module.
- write(dict) : Displays dict in an interactive widget.
- write(obj) : The default is to print str(obj).
- write(mpl_fig) : Displays a Matplotlib figure.
- write(altair) : Displays an Altair chart.
- write(keras) : Displays a Keras model.
- write(graphviz) : Displays a Graphviz graph.
- write(plotly_fig) : Displays a Plotly figure.
- write(bokeh_fig) : Displays a Bokeh figure.
- write(sympy_expr) : Prints SymPy expression using LaTeX.
- write(markdown):
比如:
# 字典
st.write({"a": [1, 2, 3],
          "b": [2, 3, 4]})

# pandas数据框
st.write(pd.DataFrame({
    "a": [1, 2, 3, 4, 5],
    "b": [4, 5, 6, 7, 8]
}))

# Markdown文字
st.write("Hello, *World!* :sunglasses:")

# 绘图对象
df = pd.DataFrame(
    np.random.randn(200, 3),
    columns=["a", "b", "c"]
)

c = alt.Chart(df).mark_circle().encode(
    x="a", y="b", size="c", color="c", tooltip=["a", "b", "c"])
st.write(c)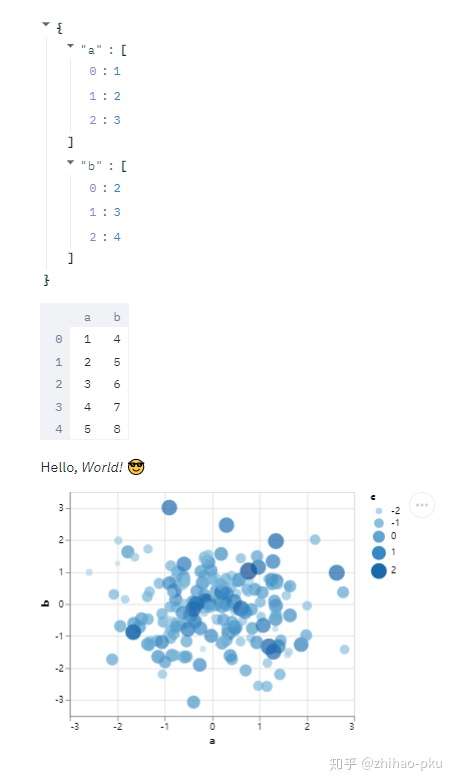
表格
两种表格,动态表格和静态表格
# 动态表格(表格太大时只展示一部分,可滑动表格下方滑动条查看不同部分)
# st.write默认调用st.dataframe()
df = pd.DataFrame(
    np.random.randn(10, 20),
    columns=('col %d' % i for i in range(20)))

st.write(df)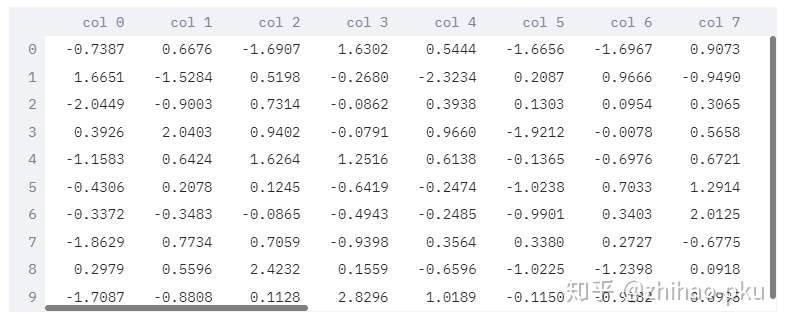
# 静态表格(展示表格全部内容,太大时滑动App界面下方的滑动条查看不同部分)
df = pd.DataFrame({
    "a": [1, 2, 3, 4, 5],
    "b": [4, 5, 6, 7, 8]
})

st.table(df)
pandas.DataFrame 的 style 也可正常显示
df = pd.DataFrame(
    np.random.randn(10, 20),
    columns=('col %d' % i for i in range(20)))

st.dataframe(df.style.highlight_max(axis=0))

<streamlit.DeltaGenerator.DeltaGenerator at 0x28b60f62048>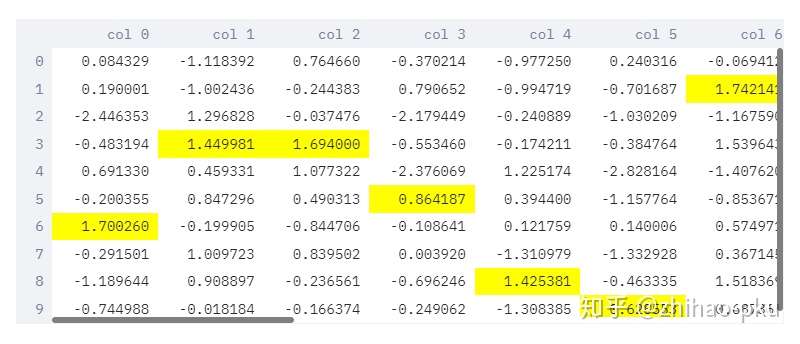
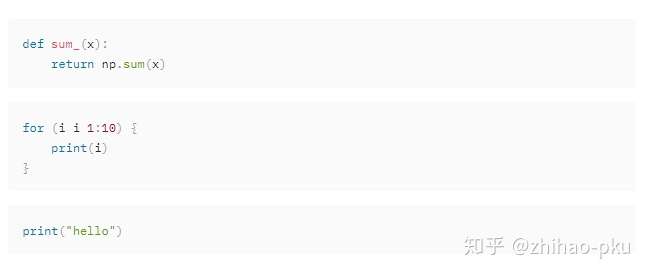
Code
仅展示 Code,Code 不执行
code = """
def sum_(x):
return np.sum(x)
"""
st.code(code, language="python")
code = """
for (i i 1:10) {
print(i)
}
"""
st.code(code, language="r")
st.markdown("""
```python
print("hello")
""")
展示 Code,同时执行 Code;需要将 code 放入 st.echo() 内
with st.echo():
    for i in range(5):
        st.write("hello")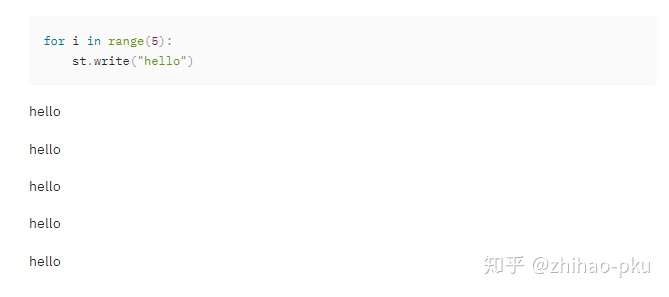
各种控件
# 数字输入框
number = st.number_input("Insert a number", 123)
# 单行文本输入框
word = st.text_input("Insert a word", "123")
st.write("The number is", number, "The word is", word)
# 多行文本输入框
st.text_area("Text to analyze", "I love China")
# 日期输入框
st.date_input("Insert a date")
# 时间输入框
st.time_input("Insert a time")
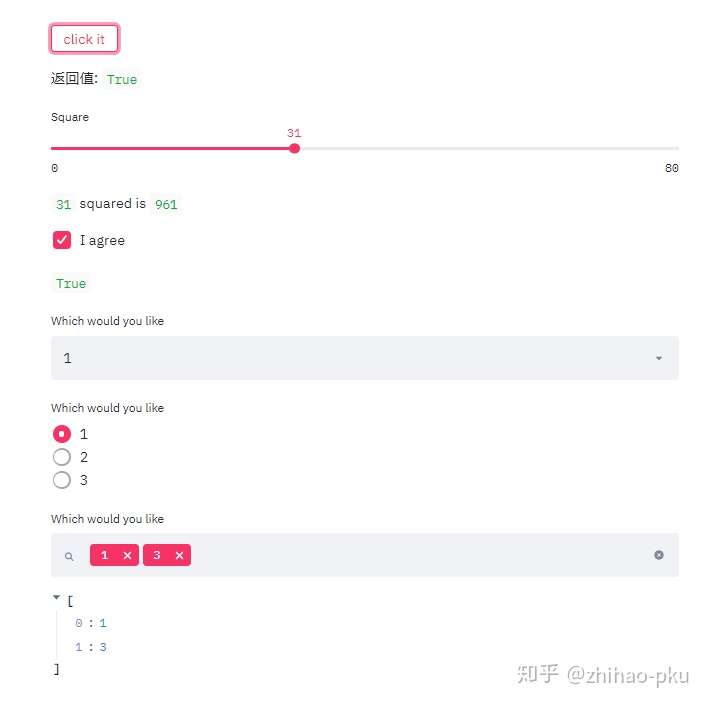
# 点击按钮
number = st.button("click it")
st.write("返回值:", number)
# 滑动条
x = st.slider("Square", min_value=0, max_value=80)
st.write(x, "squared is", np.power(x, 2))
# 检查框
res = st.checkbox("I agree")
st.write(res)
# 单选框
st.selectbox("Which would you like", [1, 2, 3])
# 单选按钮
st.radio("Which would you like", [1, 2, 3])
# 多选框
selector = st.multiselect("Which would you like", [1, 2, 3])
st.write(selector)
# 气球效果
st.balloons()
上传 csv 文件
uploaded_file = st.file_uploader("Choose a CSV file", type="csv")

if uploaded_file is not None:
    data = pd.read_csv(uploaded_file)
    st.write(data)
下载:目前 Streamlit 还没有专门的下载控件,下载 pandas Dataframe 为 csv 文件可通过以下方式实现
点击 Download CSV File 便可下载文件
data = [(1, 2, 3)]
df = pd.DataFrame(data, columns=["Col1", "Col2", "Col3"])
csv = df.to_csv(index=False)
b64 = base64.b64encode(csv.encode()).decode()
href = f'<a href="data:file/csv;base64,{b64}">Download CSV File</a> (right-click and save as <some_name>.csv)'
st.markdown(href, unsafe_allow_html=True)
侧边栏控件
以上控件大部分都有对应的侧边栏形式,如上述 st.selectbox 若想放置在侧边栏,可使用 st.sidebar.selectbox
# 单选框
st.sidebar.selectbox("Which would you like", [1, 2, 3], key="1")

# 单选按钮
st.sidebar.radio("Which would you like", [1, 2, 3], key="1")

# 多选框
selector = st.sidebar.multiselect("Which would you like", [1, 2, 3], key="3")
st.write(selector)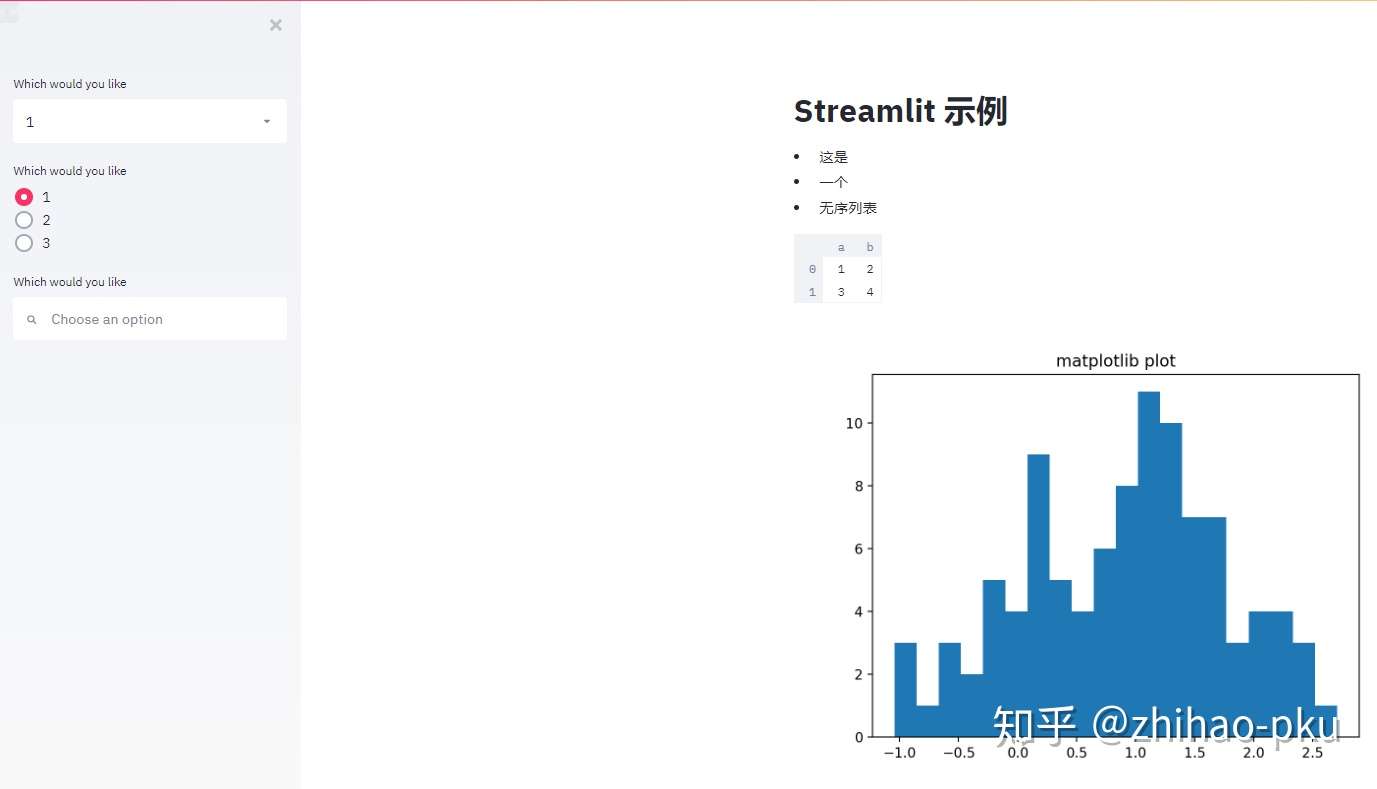
绘图、图片、音频、视频
支持的绘图库:
- streamlit 自带绘图:
st.line_chart()、bar_chart()等 - matplotlib 或 seaborn:
st.pyplot() - altair:
st.altair_chart() - vega:
st.vega_lite_chart() - plotly:
st.plotly_chart() - bokeh:
st.bokeh_chart()
streamlit 自带绘图
st.line_chart() 和 st.bar_chart()
st.line_chart(np.random.randn(10, 2))

chart_data = pd.DataFrame(
    np.random.randn(50, 3),
    columns=["a", "b", "c"]
)
st.bar_chart(chart_data)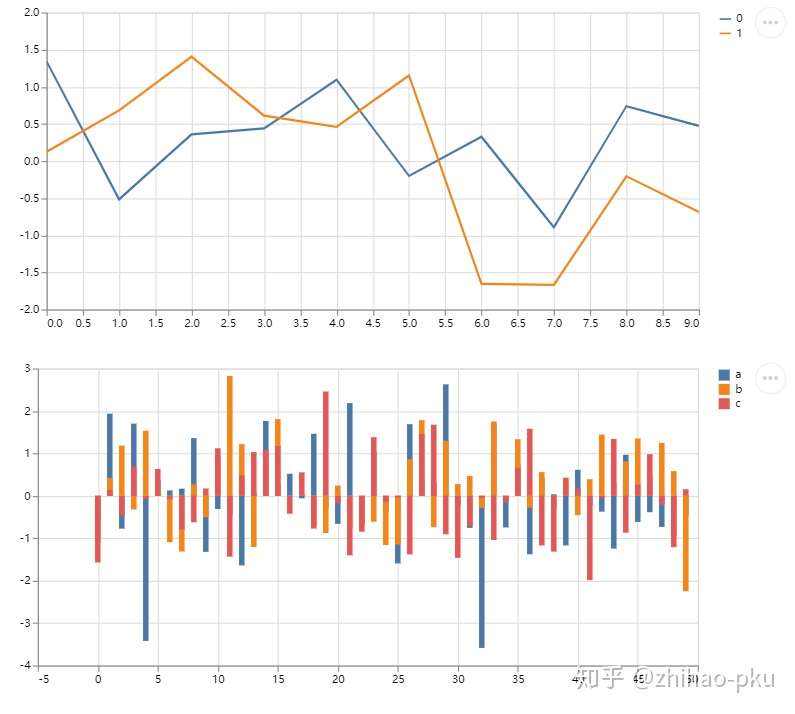
matplotlib 或 seaborn 绘图
st.markdown("# matplotlib绘图")

arr = np.random.normal(1, 1, size=100)
plt.hist(arr, bins=20)
st.pyplot()

st.markdown("# seaborn绘图")

tips = sns.load_dataset("tips")
sns.set(style="darkgrid")
sns.scatterplot(x="total_bill", y="tip", hue="smoker", data=tips)
st.pyplot()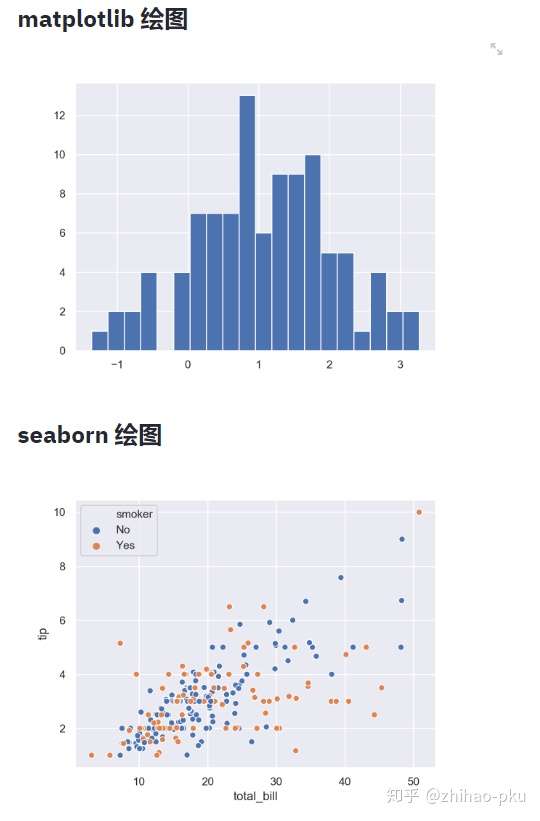
plotly 绘图
x1 = np.random.randn(200) - 2
x2 = np.random.randn(200)
x3 = np.random.randn(200) + 2

hist_data = [x1, x2, x3]
group_labels = ["Group 1", "Group 2", "Group 3"]
fig = ff.create_distplot(
    hist_data, group_labels,
    bin_size=[0.1, 0.25, 0.5])

st.markdown("# plotly绘图")
st.plotly_chart(fig)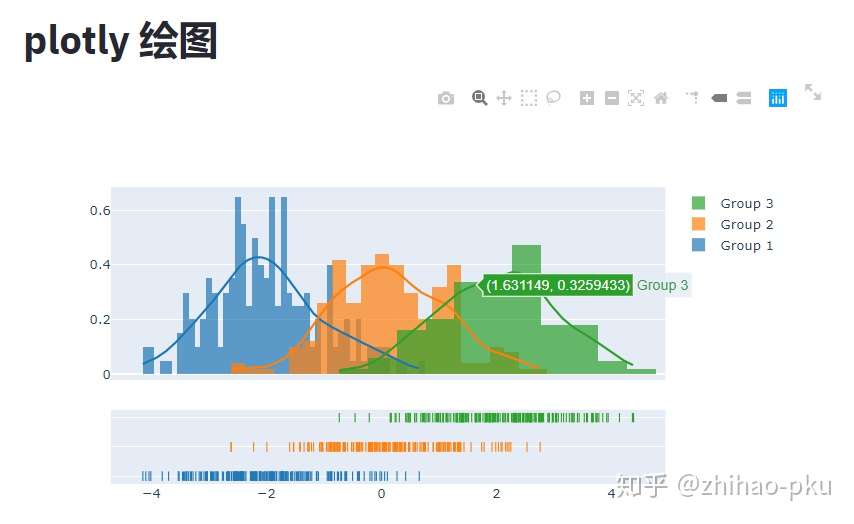
地图
# 绘制1000个点的坐标
map_data = pd.DataFrame(
    np.random.randn(1000, 2) / [50, 50] + [37.76, -122.4],
    columns=['lat', 'lon'])

st.map(map_data)
展示图片、音频、视频
- 图片:st.image ()
- 音频:st.audio ()
- 视频:st.video ()
状态
st.error("错误显示为")
st.warning("警告显示为")
st.info("普通消息显示为")
st.success("成功消息显示为")
展示进度
占位符
占位符可在后续向其中添加内容
# 添加两个占位符
slot1 = st.empty()
slot2 = st.empty()

# 占位符中插入文字
time.sleep(0.5)
slot1.markdown("# This will appear")

# 占位符中画图
time.sleep(0.5)
slot2.line_chart(np.random.randn(20, 2))
进度条
# 添加占位符
placeholder = st.empty()
# 创建进度条
bar = st.progress(0)

for i in range(100):
    time.sleep(0.05)
    # 不断更新占位符的内容
    placeholder.text(f"Iteration {i+1}")
    # 不断更新进度条
    bar.progress(i + 1)

# 状态
st.success("Finished")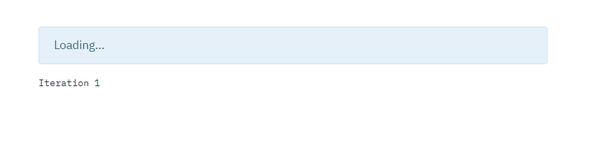
等待条
with st.spinner("Wait for it..."):
    for i in range(100):
        print("hello")
        time.sleep(0.05)

st.success("Done!")
动态扩增表格或动态绘图
表格、图片可以使用 add_rows() 方法添加新数据
动态扩增表格
df1 = pd.DataFrame(
    np.random.randn(5, 5),
    columns=("col %d" % i for i in range(5))
)
tb_table = st.table(df1)

for i in range(10):
    df2 = pd.DataFrame(
        np.random.randn(1, 5),
        columns=("col %d" % i for i in range(5))
    )
    tb_table.add_rows(df2)
    time.sleep(0.5)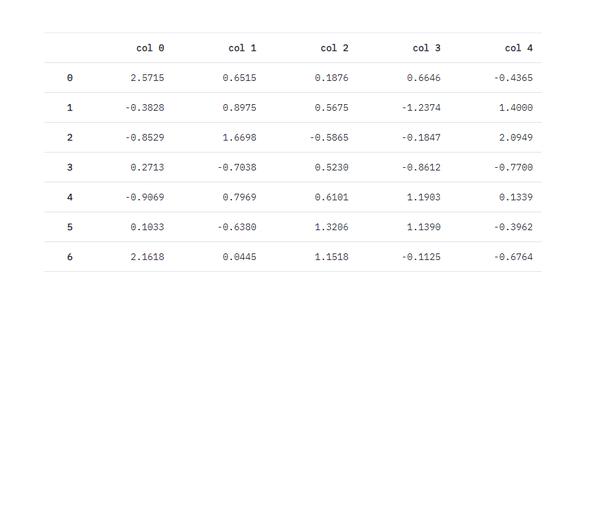
动态折线图
pb = st.progress(0)
status_txt = st.empty()
chart = st.line_chart(np.random.randn(10, 2))

for i in range(100):
    pb.progress(i)
    new_rows = np.random.randn(10, 2)
    status_txt.text(
        "The latest number is: %s" % new_rows[-1, 1]
    )
    chart.add_rows(new_rows)
    time.sleep(0.05)
缓存
对于费时间的步骤,可打包成函数,并使用缓存;第一次调用函数时,正常运行过程;第二次调用函数时,则不再重新计算,而是直接使用上一步调用函数时返回的结果。
@st.cache() # 使用缓存
def compute_long_time():
    SUM = 0
    for i in range(100):
        SUM += i
        time.sleep(0.05)
    return SUM
第一次调用函数,费时较长
st.write(compute_long_time())再次调用该函数,瞬间出结果
st.write(compute_long_time())Magic commands
Streamlit 提供了魔法方法,对于某些内容,直接书写便会自动调用 st.write ()
"***hello world***"

"""
# This is the document title

This is some _markdown_.
"""

# ---------------------------------

st.write("***hello world***")

st.write("""
# This is the document title

This is some _markdown_.
""")

# ---------------------------------

st.markdown("***hello world***")

st.markdown("""
# This is the document title

This is some _markdown_.
""")
可以看到,以上三种书写展示结果相同,原因为第一种方式会自动调用 st.write()(魔法方法),而 st.write() 为一个泛型函数,内部传入 Markdown 时会自动调用 st.markdown(),因此三种方式归根结底都是使用了 st.markdown()

展示 df 和 x,两者效果相同
df = pd.DataFrame({"col1": [1, 2, 3]})
df

x = 10
"x", x

# ---------------------------------

df = pd.DataFrame({"col1": [1, 2, 3]})
st.write(df) # 默认调用st.dataframe()

x = 10
st.write("x", x)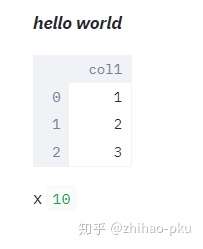
其他可参考的资料
Streamlit 官方教程:有大量示例,非常好懂
awesome-streamlit:Streamlit 各类资源,App 示例、教程、展示某些功能如何实现等