好不容易抽出时间将Jqplot做下最后的总结,下面通过四个例子来学习Jqplot的一些常见技巧:
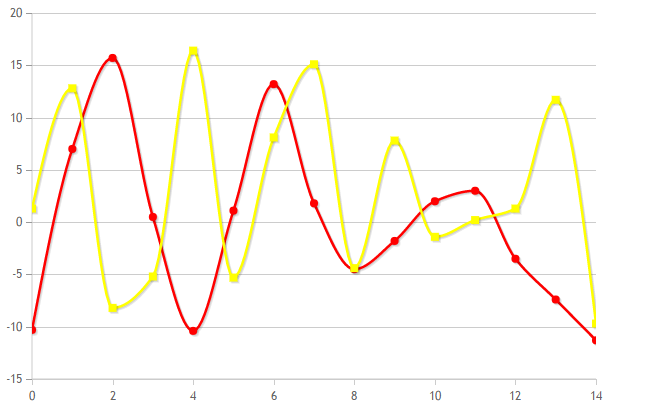
示例1. 设置线条颜色(包括背景色及线条颜色的批量赋值)


<!DOCTYPE html>
<html>
<head>
    <title>Jqplot Testing</title>
    <link class="include" rel="stylesheet" type="text/css" href="../jquery.jqplot.min.css" />
    <script class="include" type="text/javascript" src="http://ajax.googleapis.com/ajax/libs/jquery/1.9.1/jquery.min.js"></script>
</head>
<body>
 <div id="Chart1" style="height:400px; 600px;"></div>
    <script type="text/javascript" class="code">
    $(document).ready(function(){
        var d1 = [[0, -10.3], [1, 7.0], [2, 15.7], [3, 0.5], [4, -10.4], [5, 1.1], [6, 13.2],[7, 1.8], [8, -4.5], [9, -1.8], [10, 2.0], [11, 3.0], [12, -3.5], [13, -7.4], [14, -11.3]];
        var d2 = [[0, 1.3], [1, 12.8], [2, -8.2], [3, -5.2], [4, 16.4], [5, -5.3], [6, 8.1],[7, 15.1], [8, -4.4], [9, 7.8], [10, -1.4], [11, 0.2], [12, 1.3], [13, 11.7], [14, -9.7]];

        var plot1 = $.jqplot('Chart1', [d1, d2], {
            grid: {
                drawBorder: false,
                shadow: false,
                //The background color of the whole chart.
                background: '#FFFFFF'
            },
            highlighter: { show: true },
            seriesDefaults: {
                shadowAlpha: 0.1,
                shadowDepth: 2,
                fillToZero: true
            },
            series: [
                {
                    color: 'red',
                    showMarker: true,
                    showLine: true,
                    markerOptions: {
                        style: 'filledCircle',
                        size: 8
                    },
                    rendererOptions: {
                        smooth: true
                    }
                },
                {
                    color: 'yellow',
                    showMarker: true,
                    showLine: true,
                    rendererOptions: {
                        smooth: true,
                    },
                    markerOptions: {
                        style: 'filledSquare',
                        size: 8
                    },
                }
            ],
            axes: {
                xaxis: {
                    pad: 1.0,
                    tickOptions: {
                      showGridline: false
                    }
                },
                yaxis: {
                    pad: 1.05
                }
            }
        });
    });
    </script>
    <script class="include" type="text/javascript" src="../jquery.jqplot.min.js"></script>
    <script class="include" type="text/javascript" src="../plugins/jqplot.highlighter.min.js"></script>
</body>
</html>
效果演示:
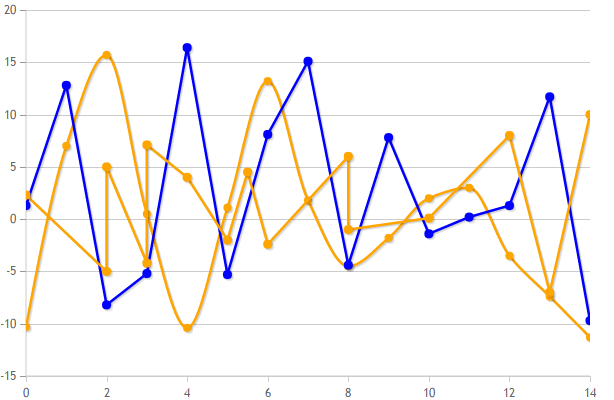
示例2. 线条常见的属性控制及特点,本例中需要注意一下两点:
A. 本例定义了两种颜色,但共有三条线,所以颜色会轮流显示;
*有时鼠标放在节点上没有值显示或线条颜色显示黑色,有可能是加的颜色Chart无法识别;
B. series: [{ show: true }, { showLine: true, showLabel: false }]
此处需要注意的是如果需要精确控制每条线的显示,有几组数据,就要写几组属性控制列表.
<!DOCTYPE html>
<html>
<head>
    <title>Jqplot Testing</title>
    <link class="include" rel="stylesheet" type="text/css" href="../jquery.jqplot.min.css" />
    <script class="include" type="text/javascript" src="http://ajax.googleapis.com/ajax/libs/jquery/1.9.1/jquery.min.js"></script>
</head>
<body>
 <div id="Chart2" style="height:400px; 600px;"></div>
    <script type="text/javascript" class="code">
    $(document).ready(function(){
        var d1 = [[0, -10.3], [1, 7.0], [2, 15.7], [3, 0.5], [4, -10.4], [5, 1.1], [6, 13.2],[7, 1.8], [8, -4.5], [9, -1.8], [10, 2.0], [11, 3.0], [12, -3.5], [13, -7.4], [14, -11.3]];
        var d2 = [[0, 1.3], [1, 12.8], [2, -8.2], [3, -5.2], [4, 16.4], [5, -5.3], [6, 8.1],[7, 15.1], [8, -4.4], [9, 7.8], [10, -1.4], [11, 0.2], [12, 1.3], [13, 11.7], [14, -9.7]];
        var d3 = [[0, 2.3], [2, 5], [2, -5], [3, -4.2], [4, 4], [5, -2], [5.5,4.5],[3, 7.1], [6, -2.4], [8, 6], [8, -1], [10, 0.1], [12, 8], [14, 10], [13, -7]];
        var colorListForChart2 = ['orange','blue'];
        var plot2 = $.jqplot('Chart2', [d1,d2,d3], {
            grid: {
                drawBorder: false,
                shadow: false,
                //The background color of the whole chart.
                background: '#FFFFFF'
            },
            highlighter: { show: true },
            seriesDefaults: {
                shadowAlpha: 0.1,
                shadowDepth: 2,
                fillToZero: true
            },
            //总括:和chart1相比,chart2中对chart1的series进行了合并;
            //A. The usage of seriesColors;此处定义了两种颜色,但共有三条线,所以颜色会轮流显示;
            //PS.有时鼠标放在节点上没有值显示或线条颜色显示黑色,有可能是加的颜色Chart无法识别;
            seriesColors: colorListForChart2,
            //B. series: [{ show: true }, { showLine: true, showLabel: false }]
            //此处需要注意的是如果需要精确控制每条线,有几组数据,就要写几组属性控制列表.
            //此处共有三组数据,如果要精确控制每条线的显示情况,要写三组属性控制,如:[{ show: true }, { showLine: true, showLabel: false },{ showLine: true, showLabel: false }]
            series: [
                {
                    showMarker: true,
                    showLine: true,
                    markerOptions: {
                        style: 'filledCircle',
                        size: 8
                    },
                    rendererOptions: {
                        smooth: true
                    }
                }
            ],
            axes: {
                xaxis: {
                    pad: 1.0,
                    tickOptions: {
                        showGridline: false
                    }
                },
                yaxis: {
                    pad: 1.05
                }
            }
        });
    });
    </script>
    <script class="include" type="text/javascript" src="../jquery.jqplot.min.js"></script>
    <script class="include" type="text/javascript" src="../plugins/jqplot.highlighter.min.js"></script>
</body>
</html>
效果演示:
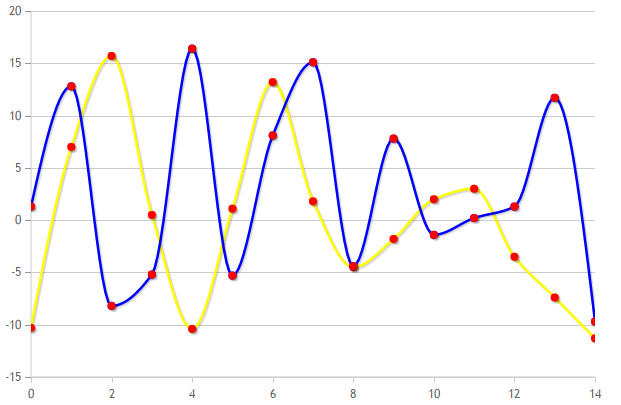
示例3. 自定义线条节点的颜色:
<!DOCTYPE html>
<html>
<head>
    <title>Jqplot Testing</title>
    <link class="include" rel="stylesheet" type="text/css" href="../jquery.jqplot.min.css" />
    <script class="include" type="text/javascript" src="http://ajax.googleapis.com/ajax/libs/jquery/1.9.1/jquery.min.js"></script>
</head>
<body>
 <div id="Chart1" style="height:400px; 600px;"></div>
 <div id="Chart2" style="height:400px; 600px;"></div>
 <div id="Chart3" style="height:400px; 600px;"></div>
    <script type="text/javascript" class="code">
    $(document).ready(function(){
        var d11 = [[0, -10.3], [1, 7.0], [2, 15.7], [3, 0.5], [4, -10.4], [5, 1.1], [6, 13.2], [7, 1.8], [8, -4.5], [9, -1.8], [10, 2.0], [11, 3.0], [12, -3.5], [13, -7.4], [14, -11.3]];
        var d12 = [[0, -10.3], [1, 7.0], [2, 15.7], [3, 0.5], [4, -10.4], [5, 1.1], [6, 13.2], [7, 1.8], [8, -4.5], [9, -1.8], [10, 2.0], [11, 3.0], [12, -3.5], [13, -7.4], [14, -11.3]];
        var d21 = [[0, 1.3], [1, 12.8], [2, -8.2], [3, -5.2], [4, 16.4], [5, -5.3], [6, 8.1], [7, 15.1], [8, -4.4], [9, 7.8], [10, -1.4], [11, 0.2], [12, 1.3], [13, 11.7], [14, -9.7]];
        var d22 = [[0, 1.3], [1, 12.8], [2, -8.2], [3, -5.2], [4, 16.4], [5, -5.3], [6, 8.1], [7, 15.1], [8, -4.4], [9, 7.8], [10, -1.4], [11, 0.2], [12, 1.3], [13, 11.7], [14, -9.7]];
        var colorListForChart3 = ['yellow','red', 'blue', 'red'];
        var plot3 = $.jqplot('Chart3', [d11, d12, d21,d22], {
            grid: {
                drawBorder: false,
                shadow: false,
                //The background color of the whole chart.
                background: '#FFFFFF'
            },
            highlighter: { show: true },
            seriesDefaults: {
                shadowAlpha: 0.1,
                shadowDepth: 2,
                fillToZero: true
            },
            seriesColors: colorListForChart3,
            series: [
                {
                    showMarker: true,
                    showLine: true,
                    markerOptions: {
                        style: 'filledCircle',
                        size: 8
                    },
                    rendererOptions: {
                        smooth: true
                    }
                },
                {
                    showMarker: true,
                    showLine: false,
                    markerOptions: {
                        style: 'filledCircle',
                        size: 8
                    },
                    rendererOptions: {
                        smooth: true
                    }
                },
                {
                    showMarker: true,
                    showLine: true,
                    markerOptions: {
                        style: 'filledCircle',
                        size: 8
                    },
                    rendererOptions: {
                        smooth: true
                    }
                },
                {
                    showMarker: true,
                    showLine: false,
                    markerOptions: {
                        style: 'filledCircle',
                        size: 8
                    },
                    rendererOptions: {
                        smooth: true
                    }
                }
            ],
            axes: {
                xaxis: {
                    pad: 1.0,
                    tickOptions: {
                        showGridline: false
                    }
                },
                yaxis: {
                    pad: 1.05
                }
            }
        });
    });
    </script>
    <script class="include" type="text/javascript" src="../jquery.jqplot.min.js"></script>
    <script class="include" type="text/javascript" src="../plugins/jqplot.highlighter.min.js"></script>
</body>
</html>
效果演示:
示例4. Jqplot的实时显示效果:
关于Jqplot的实时显示效果,主要是通过setTimeout(JqplotEvent, 1000)来进行调用的,其他逻辑及显示与以上均保持一致。