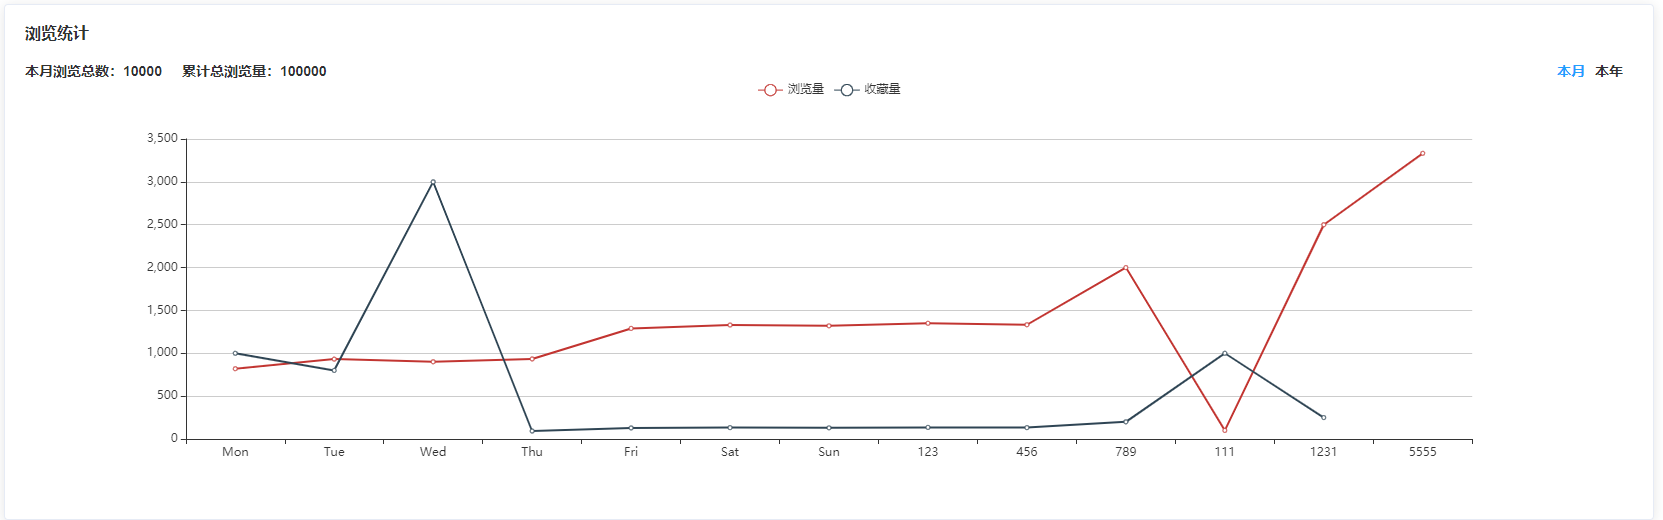
我这里使用的是官方的echarts,并没有使用vue-echarts,这里我使用的是折线图,根据需求需要什么类型的图表,就配置相应的图表选项就可以了,效果图如下:
echarts的配置语法可参考:https://www.runoob.com/echarts/echarts-setup.html
官方文档:https://echarts.apache.org/zh/option.html#title
安装echarts依赖:
npm install echarts -S
或者使用淘宝的镜像
npm install -g cnpm --registry=https://registry.npm.taobao.org
cnpm install echarts -S
或者使用淘宝的镜像
npm install -g cnpm --registry=https://registry.npm.taobao.org
cnpm install echarts -S
介绍两种使用方式:全局引入和按需引入;
1、按需引入方式如下:
在需要使用图表的页面如:home.vue中这么写:
 1 <template>
 2     // 指定图表容器,需要指定宽高,否则可能不显示
 3     <div id="myChart" class="charts-box" style=" 100%;height: 420px;" />
 4 </template>
 5
 6 <script>
 7 // 引入基本模板
 8 const echarts = require('echarts/lib/echarts')
 9 // 引入折线图组件
10 require('echarts/lib/chart/line')
11 // 引入提示框和title、图例组件
12 require('echarts/lib/component/tooltip')
13 require('echarts/lib/component/title')
14 require('echarts/lib/component/legend')
15 export default {
16     name: 'Home',
17     mounted() {
18         this.drawLine()
19     },
20     drawLine() {
21       // 基于准备好的dom,初始化echarts实例
22       const myChart = echarts.init(document.getElementById('myChart'))
23       myChart.showLoading() // 开启 loading 效果
24       setTimeout(() => {
25         myChart.hideLoading() // 隐藏 loading 效果
26       }, 2000)
27       // 绘制图表
28       myChart.setOption({
29         title: { text: '浏览统计' }, // 为图表配置标题
30         tooltip: {}, // 配置提示信息
31         xAxis: {
32           type: 'category',
33           data: ['Mon', 'Tue', 'Wed', 'Thu', 'Fri', 'Sat', 'Sun', '123', '456', '789', '111', '1231', '5555']
34         }, // 配置要在 X 轴显示的项
35         yAxis: {
36           type: 'value'
37         }, // 配置要在 Y 轴显示的项
38         legend: {
39           data: ['浏览量', '收藏量']
40         }, // 图例组件展现了不同系列的标记(symbol),颜色和名字。可以通过点击图例控制哪些系列不显示
41         series: [
42           {
43             name: '浏览量', // 系列名称
44             data: [820, 932, 901, 934, 1290, 1330, 1320, 1350, 1333, 2000, 100, 2500, 3333], // // 系列中的数据内容
45             type: 'line' // // 系列图表类型
46           },
47           {
48             name: '收藏量',
49             data: [1000, 800, 3000, 93, 129, 133, 130, 135, 133, 200, 1000, 250],
50             type: 'line'
51           }
52         ] // 系列列表
53       })
54     }
55 }
56 </script>
2、全局引入方式如下:
在main.js中
// 引入echarts
import echarts from 'echarts'
Vue.prototype.$echarts = echarts
import echarts from 'echarts'
Vue.prototype.$echarts = echarts
在需要使用图表的页面如:home.vue中这么写:
<template>
    // 图表容器,需要指定宽高
    <div id="myChart" class="charts-box" style=" 100%;height: 420px;" />
</template>

<script>
export default {
    name: 'Home',
    mounted() {
        this.drawLine()
    },
    drawLine() {
      // 基于准备好的dom,初始化echarts实例
      const myChart = this.$echarts.init(document.getElementById('myChart'))
      myChart.showLoading() // 开启 loading 效果
      setTimeout(() => {
        myChart.hideLoading() // 隐藏 loading 效果
      }, 2000)
      // 绘制图表
      myChart.setOption({
       title: { text: '浏览统计' }, // 为图表配置标题
        tooltip: {}, // 配置提示信息
        xAxis: {
          type: 'category',
          data: ['Mon', 'Tue', 'Wed', 'Thu', 'Fri', 'Sat', 'Sun', '123', '456', '789', '111', '1231', '5555']
        }, // 配置要在 X 轴显示的项
        yAxis: {
          type: 'value'
        }, // 配置要在 Y 轴显示的项
        legend: {
          data: ['浏览量', '收藏量']
        }, // 图例组件展现了不同系列的标记(symbol),颜色和名字。可以通过点击图例控制哪些系列不显示
        series: [
          {
            name: '浏览量', // 系列名称
            data: [820, 932, 901, 934, 1290, 1330, 1320, 1350, 1333, 2000, 100, 2500, 3333], // // 系列中的数据内容
            type: 'line' // // 系列图表类型
          },
          {
            name: '收藏量',
            data: [1000, 800, 3000, 93, 129, 133, 130, 135, 133, 200, 1000, 250],
            type: 'line'
          }
        ] // 系列列表
      })
    }
}
</script>
所有图标类型,每个系列通过 type 决定自己的图表类型:
- type: 'bar':柱状/条形图
- type: 'line':折线/面积图
- type: 'pie':饼图
- type: 'scatter':散点(气泡)图
- type: 'effectScatter':带有涟漪特效动画的散点(气泡)
- type: 'radar':雷达图
- type: 'tree':树型图
- type: 'treemap':树型图
- type: 'sunburst':旭日图
- type: 'boxplot':箱形图
- type: 'candlestick':K线图
- type: 'heatmap':热力图
- type: 'map':地图
- type: 'parallel':平行坐标系的系列
- type: 'lines':线图
- type: 'graph':关系图
- type: 'sankey':桑基图
- type: 'funnel':漏斗图
- type: 'gauge':仪表盘
- type: 'pictorialBar':象形柱图
- type: 'themeRiver':主题河流
- type: 'custom':自定义系列