根据 x 坐标和 y 坐标一一对应进行设置 (x,y)
{
  "type": "line",
  "series":[
    {"values":[[0,20],[1,40],[3,50],[4,15],[6,33],[7,34]]} /* Plot indices 2 and 5 are unavailable */
  ]
}
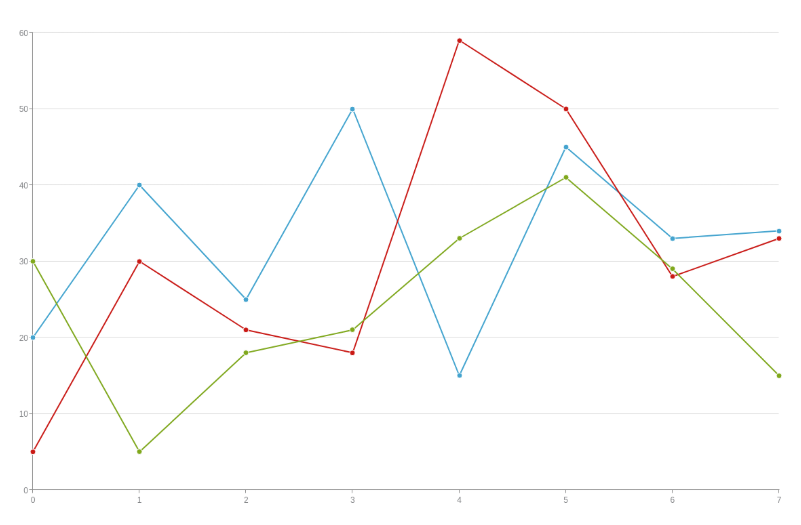
直接设置 y 坐标的值
{
  "type": "line",
  "series": [
    {"values":[20,40,25,50,15,45,33,34]},
    {"values":[5,30,21,18,59,50,28,33]},
    {"values":[30,5,18,21,33,41,29,15]}
  ]
}
官网资料: