序列变点检测在金融气象等领域的应用十分广泛。最近我在分析表观遗传数据的时候也用到了这项功能,当然是基于R语言进行分析的。
下面给出一个简单的使用示例。
- 安装cpm包。
install.packages("cpm") #初次使用需安装,以后就不需要了
library(cpm)
- 产生示例数据,并可视化查看数据。
df <- data.frame(x = 1:200, y = c(rnorm(50, 10), rnorm(50, 5), rnorm(50, 0), rnorm(50, 10)))
par(mfrow = c(2,1))
plot(df, type = "l", col = "steelblue", lwd = 2)
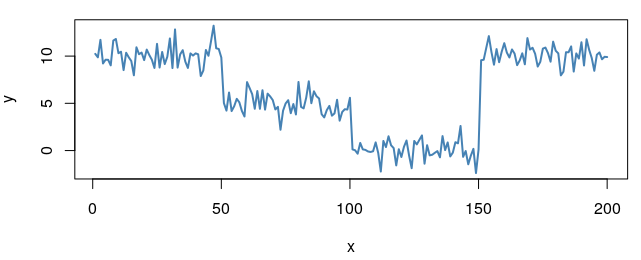
- 很明显,我们这里有三个非常明显的change point。
在这里说明下,如果你是要检测单个change point的话,应该使用detectChangePoint函数,但是在这个实例里,我们显然是想检测出多个,此时应该使用processStream函数。
processStream函数的cpmType参数的值有很多,主要有以下几种,
| Arguments | Condition |
|---|---|
| Student | Gaussian sequence |
| Bartlett | Gaussian sequence |
| GLR | Gaussian sequence |
| Exponential | Exponentially distributed sequence |
| GLRAdjusted; ExponentialAdjusted | Identical to the GLR and Exponential statistics |
| FET | Bernoulli sequence |
| Mann-Whitney | non-Gaussian distribution |
| Mood | non-Gaussian distribution |
| Lepage | non-Gaussian distribution |
| Kolmogorov-Smirnov | non-Gaussian distribution |
| Cramer-von-Mises | non-Gaussian distribution |
shapiro.test(df$y) #检验数据是否服从高斯分布,发现不服从。所以选择一个非高斯分布的方法使用

#        Shapiro-Wilk normality test

# data:  df$y

# W = 0.89808, p-value = 1.899e-10

cpm.res = processStream(df$y, cpmType = "Kolmogorov-Smirnov")

# 可视化变点

plot(df, type = "l", col = "steelblue", lwd = 2)

abline(v = cpm.res$changePoints, lwd = 3.5, col = "red")

# 变点坐标信息提取

print(cpm.res$changePoints)

# [1]  50 100 150
