一、数据排序整合
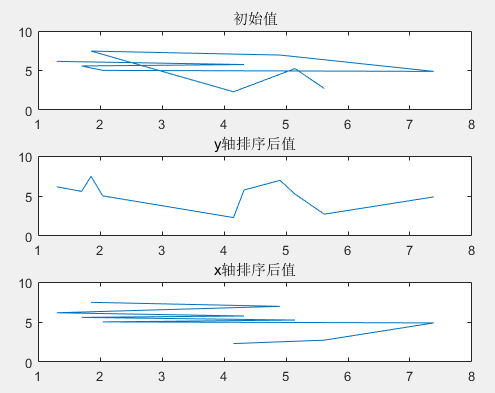
1、随机生成的数,从小到大排序
clear
rand('seed',1)%设置随机种子,确保随机数一样
edge_range=unifrnd (1, 10, 1, 10)
edge_height=unifrnd (1, 10, 1, 10)
subplot(311),plot(edge_range,edge_height)
title('初始值')

temp(:,1) = edge_range.';%对应起来
temp(:,2) = edge_height.';

temp = sortrows(temp);%按列排序
edge_range1 = temp(:,1).'
edge_height2 = temp(:,2).'
subplot(312),plot(edge_range1,edge_height2)
title('y轴排序后值')

temp = sortrows(temp,2);%按第二列列排序
edge_range1 = temp(:,1).'
edge_height2 = temp(:,2).'
subplot(313),plot(edge_range1,edge_height2)
title('x轴排序后值')
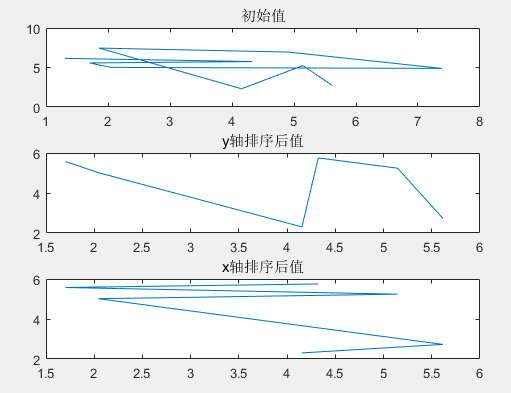
2、
clear
rand('seed',1)%设置随机种子,确保随机数一样
edge_range=unifrnd (1, 10, 1, 10)
edge_height=unifrnd (1, 10, 1, 10)
subplot(311),plot(edge_range,edge_height)
title('初始值')

temp(:,1) = edge_range.';%对应起来
temp(:,2) = edge_height.';

ind = find(edge_range<6);%限制范围
ind2 = find(edge_height<6);%(m)
ind = intersect(ind,ind2);% 两个向量求交集
% ind = unique(sort(ind));%排序
temp = temp(ind,:);%????

temp = sortrows(temp);%按列排序
edge_range1 = temp(:,1).'
edge_height2 = temp(:,2).'
subplot(312),plot(edge_range1,edge_height2)
title('y轴排序后值')

temp = sortrows(temp,2);%按列排序
edge_range1 = temp(:,1).'
edge_height2 = temp(:,2).'
subplot(313),plot(edge_range1,edge_height2)
title('x轴排序后值')
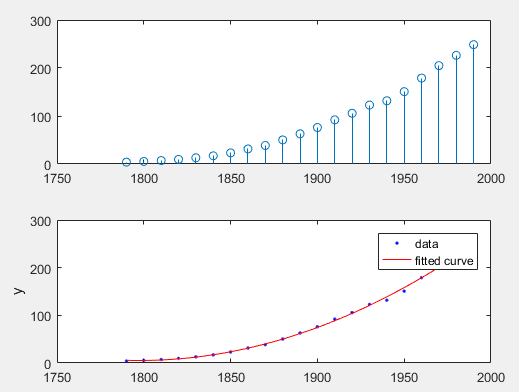
二、数据拟合
1、
clear all
load census;
subplot(211),
stem(cdate,pop)
f=fit(cdate,pop,'poly2');
subplot(212)
plot(f,cdate,pop)
2、
clear all
aa = sin(0:0.05:pi);%正弦函数
aa = aa+randn(1,63)/10;%添加噪声
bb = 0:0.05:pi;
subplot(211),plot(bb,aa,'bo');%图像
ff = fit(bb',aa','poly2');%2阶拟合
subplot(212),plot(ff,bb,aa);%拟合图像

拟合公式

计算偏移值和方差
figure
cc=-0.396*bb.^2+1.277*bb+-0.07073;%拟合方程
dd=cc-aa;%偏移值
plot(bb,dd)
s=std(dd);%标准差
ff=sqrt(sum((dd-mean(dd)).^2/(length(dd)-1)));%偏移值的标准差

ee=(cc-aa).^2/(length(cc)-1);
ee=sqrt(sum(ee));
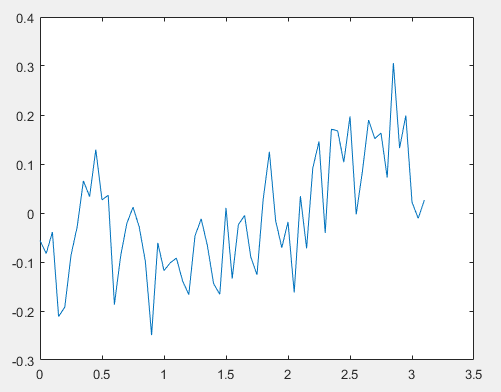

可以看到ff和s相等,而ee与之不相等。
figure
x=0:0.05:2*pi;%扩充坐标轴
y=ff(x);
plot(x,y)
hold on
plot(bb,aa,'bo')
