1.with debug, add a break point on statements EXPORT TO MEMORY (and IMPORT FROM MEMORY eventually)

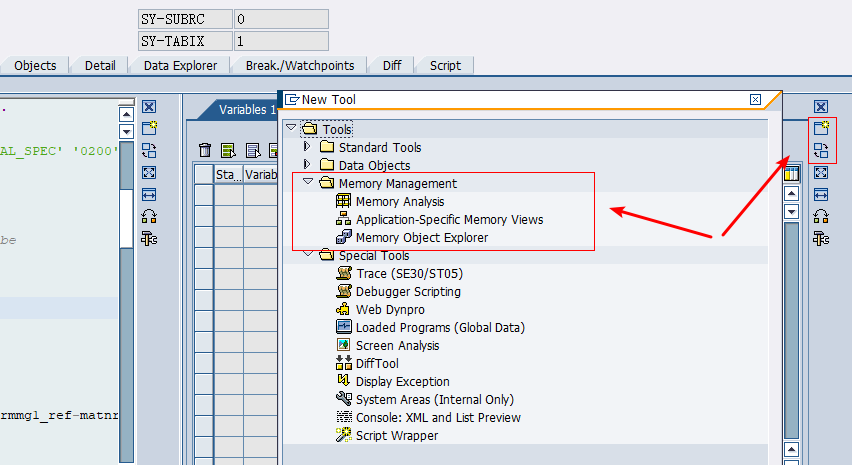
- In the new Debugger, change one of the tools you're using. Do this by clicking the "New Tool" or "Replace Tool" that you can see at the top of the vertical button column on the right of each subwindow. Open the Special Tools folder in the tree and select "System Areas (Internal Only)". In the second tab of this tool you can now see a list of areas. Double-click MEMORIES (or manually enter it in the AREA dialog) to open the list of active memory IDs. Click through on any one to see its hexadecimal value.
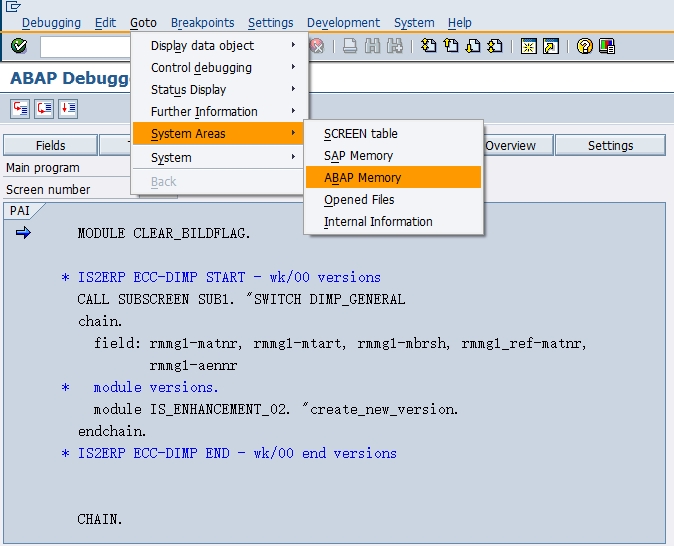
- In the menu bar, open Debugger and select "Switch to Classic Debugger". Once it opens, find the following in the menu bar: Goto, System Areas, ABAP Memory. The system areas will be displayed with the MEMORIES area selected by default.
2.Run an ABAP source code scan with RPR_ABAP_SOURCE_SCAN