Snapdragon Profiler: https://developer.qualcomm.com/software/snapdragon-profiler
GTK# for .NET: https://www.mono-project.com/download/stable/#download-win
NDK: https://developer.android.google.cn/ndk/downloads/
Realtime
Process: Per-Process Metrics - These are process specific metrics that will only apply to the currently selected process.
CPU: CPU performance metrics for the process.
CPU Utilization %: % of CPU time the process is active.
EGL
Avg Frame Time: Time for one frame in seconds
FPS: Frames per second
GPU General
Clocks / Second: Number of GPU clocks per second.
GPU Memory Stats
Avg Bytes / Fragment: Average number of bytes transferred from main memory for each fragment.
Avg Bytes / Vertex: Average number of bytes transferred from main memory for each vertex.
Read Total (Bytes / sec): Total number bytes read by the GPU from memory, persecond
SP Memory Read (Bytes / Second): Bytes of data from memory by the Shader Processors, per second.
Texture Memory Read BW (Bytes / Second): Bytes of texture data read from memory per second. Includes bytes of platform compressed texture data read from memory.
Vertex Memory Read (Bytes / Second): Bytes of vertex data read from memory per second.
Write Total (Bytes / sec): Total number of bytes written by the GPU to memory, per second.
GPU Preemption
Avg Preemption Delay: Average time (us) from the preemption request to preemption start.
Preemption / second: The number of GPU preemptions that occurred, per second.
GPU Shader Processing
% Anisotropic Filtered: Percent of texels filtered using the 'Anisotropic' sampling method
% Linear Filtered: Percent of texels filtered using the 'Linear' sampling method
% Nearest Filtered: Percent of texels filtered using the 'Nearest' sampling method
% Non-Base Level Textures: Percent of texels coming from a non-base MIP level
% Shader ALU Capacity Utilized: Percent of maximum shader capacity (ALU operations) utilized. For each cycle that the shaders are working, the average percentage of the total shader ALU capacity that is utilized for that cycle
% Shader Busy: Percentage of time that all Shader cores are busy.
% Time ALUs Working: Percentage of time that ALUs are working while the Shaders are busy.
% Time Compute: Amount of time spent in compute work compared to the total time spent shading everything.
% Time EFUs Working: Percentage of time the EFUs are working while the Shaders are busy.
% Time Shading Fragments: Amount of time spent shading fragments compared to the total time spent shading everything
% Time Shading Vertices: Amount of time spent shading vertices compared to the total time spent shading everything
ALU / Fragment: Average number of scalar fragment shader ALU instructions issued per shaded fragment, expressed as full precision ALUs (2 mediump = 1fullp). Includes interpolation instruction. Does not include vertex shader instructions
ALU / Vertex: Average number of vertex scalar shader ALU instructions issued per shaded vertex. Does not include fragment shader instructions.
EFU / Fragment: Average number of scalar fragment shader EFU instructions issued per shaded fragment. Does not include Vertex EFU instructions
EFU / Vertex: Average number of scalar vertex shader EFU instructions issued per shaded vertex. Does not include fragment EFU instructions
Fragment ALU Instructions / Sec (Full): Total number of full precision fragment shader instructions issued, per second. Does not include medium precision instructions or texture fetch instructions
Fragment ALU Instructions / Sec (Half): Total number of half precision Scalar fragment shader instructions issued, per second. Does not include full precision instructions or texture fetch instructions.
Fragment EFU Instructions / Second: Total number of Scalar fragment shader Elementary Function Unit(EFU) instructions issued, per second. These include math functions like sin, cos, pow, etc.
Fragment Instructions / Second: Total number of fragment shader instructions issued, per second. Reported as full precision scalar ALU instructions - 2 medium precision instructions equal 1 full precision instruction. Also includes interpolation instructions (which are executed on the ALU hardware) and EFU (Elementary Function Unit) instructions. Does not include texture fetch instructions
Fragments Shaded / Second: Number of fragments submitted to the shader engine, per second.
Textures / Fragment: Average number of textures referenced per fragment.
Textures / Average: Average number of textures referenced per vertex.
Vertex Instructions / Second: Total number of scalar vertex shader instructions isseud, per second. Includes full precision ALU vertex instructions and EFU vertex instructions. Does not include medium precision instructions (since they are not used for vertex shaders). Does not include vertex fetch or texture fetch instructions.
Vertices Shaded / Second: Number of vertices submitted to the shader engine, per second.
GPU Stalls
% Stalled on System Memoy: Percentage of cycles the L2 cache is stalled waiting for data from system memory.
% Texture Fetch Stall: Percentage of clock cycles where the shader processors cannot make any more requests for texture data. A high value for this metric implies the shaders cannot get texture data from the texture pipe (L1, L2 cache or memory) fast enough, and rendering performance may be negatively.
% Texture L1 Miss: Number of L1 texture cache misses divided by L1 texture cache requests. This metric does not consider how many texture requests are made per time period (like the '% GPU L1 Texture cache miss' metric), but is simple miss to request ratio.
% Texture L2 Miss: Number of L2 texture cache misses divided by L2 texture cache requests. This metric does not consider how many texture requests are made per time period, but is simple miss to request ratio.
% Vertex Fetch Stall: Percentage of clock cycles where the GPU cannot make any more requests for vertex data. A high value for this metric implies the GPU cannot get vertex data from memory fast enough, and rendering performance may be negatively affected.
L1 Texture Cache Miss Per Pixel: Average number of Texture L1 cache misses per pixel. Lower values for this metric imply better memory coherency. If this value is high, consider using compressed textures, reducing texture usage, etc.
Memory: Memory performance metrics for the process
Memory Usage: Memory (RAM) used by the process in bytes.
Network: Network data statistics
Rx Bytes (TCP): TCP bytes received by this process.
Rx Bytes (Total): Total bytes received by this process.
Rx Bytes (UDP): UDP bytes received by this process.
Tx Bytes (TCP): TCP bytes sent by this process.
Tx Bytes (Total): Total bytes sent by this process.
Tx Bytes (UDP): UDP bytes sent by this process.
Primitive Processing
% Prims Clipped: Percentage of primitives clipped by the GPU (where new primitives are generated). For a primitive to be clipped, it has to have a visible portion inside the viewport but extend outside the 'guardband' - an area that surrounds the viewport and significantly reduces the number of primitives the hardware has to clip.
% Prims Trivially Rejected: Percentage of primitives that are trivially rejected. A primitive can be trivially rejected if it is outside the visible region of the render surface. These primitives are ignored by the rasterizer
Average Polygon Area: Average number of pixels per polygon. Adreno's binning architecture will count a primitive for each 'bin' it covers, so this metric may not exactly match expectations.
Average Vertices / Polygon: Average number of vertices per polygon. This will be around 3 for triangles, and close to 1 for triangle strips.
Pre-clipped Polygons / Second: Number of polygons submitted to the GPU, per second, before any hardware clipping.
Reused Vertices / Second: Number of vertices used from the post-transform vertex buffer cache. A vertex may be used in multiple primitives; a high value for this metric (compared to number of vertices shaded) indicates good re-use of transformed vertices, reducing vertex shader workload.
System: System Level Metrics - These are the universal for any process.
CPU Core Frequency: CPU Core frequencies in Hz.
CPU Core Load: Load on CPU Core (CPU Frequency * CPU % Utilization)
CPU Core Utilization: Percentage of CPU time a CPU Core is active
DSP - Application: DSP Metrics
DSP - Compute: DSP Metrics
GPU General: Basic GPU metrics
GPU Memory Stats: GPU memory access related metrics.
GPU Preemption: GPU preemption related metrics
GPU Shader Processing: Metrics related to GPU shader processing
GPU Stalls: GPU metrics that measure stalls within the pipeline.
Network - WiFi: Network statistics for WiFi interface
Primitive Processing: Metrics relating to primitive counts, rejection, etc.
System Memory: Memory performance metrics for the system.
Thermal: Temperature related metrics
User Guide
3. Install, Launch, and Content
1. Overview
Snapdragon Profiler allows developers to analyze CPU, GPU, DSP*, memory, power, thermal, and network data, so they can find and fix performance bottlenecks.
GPU APIs: OpenGL ES 3.1, Open CL 2.1, and Vulkan 1.0**
* Requires a Snapdragon 820 (or later) processor
** Requires Android N (or Android 6.0 device with a graphic driver that supports Vulkan)
1.1 Data capture modes
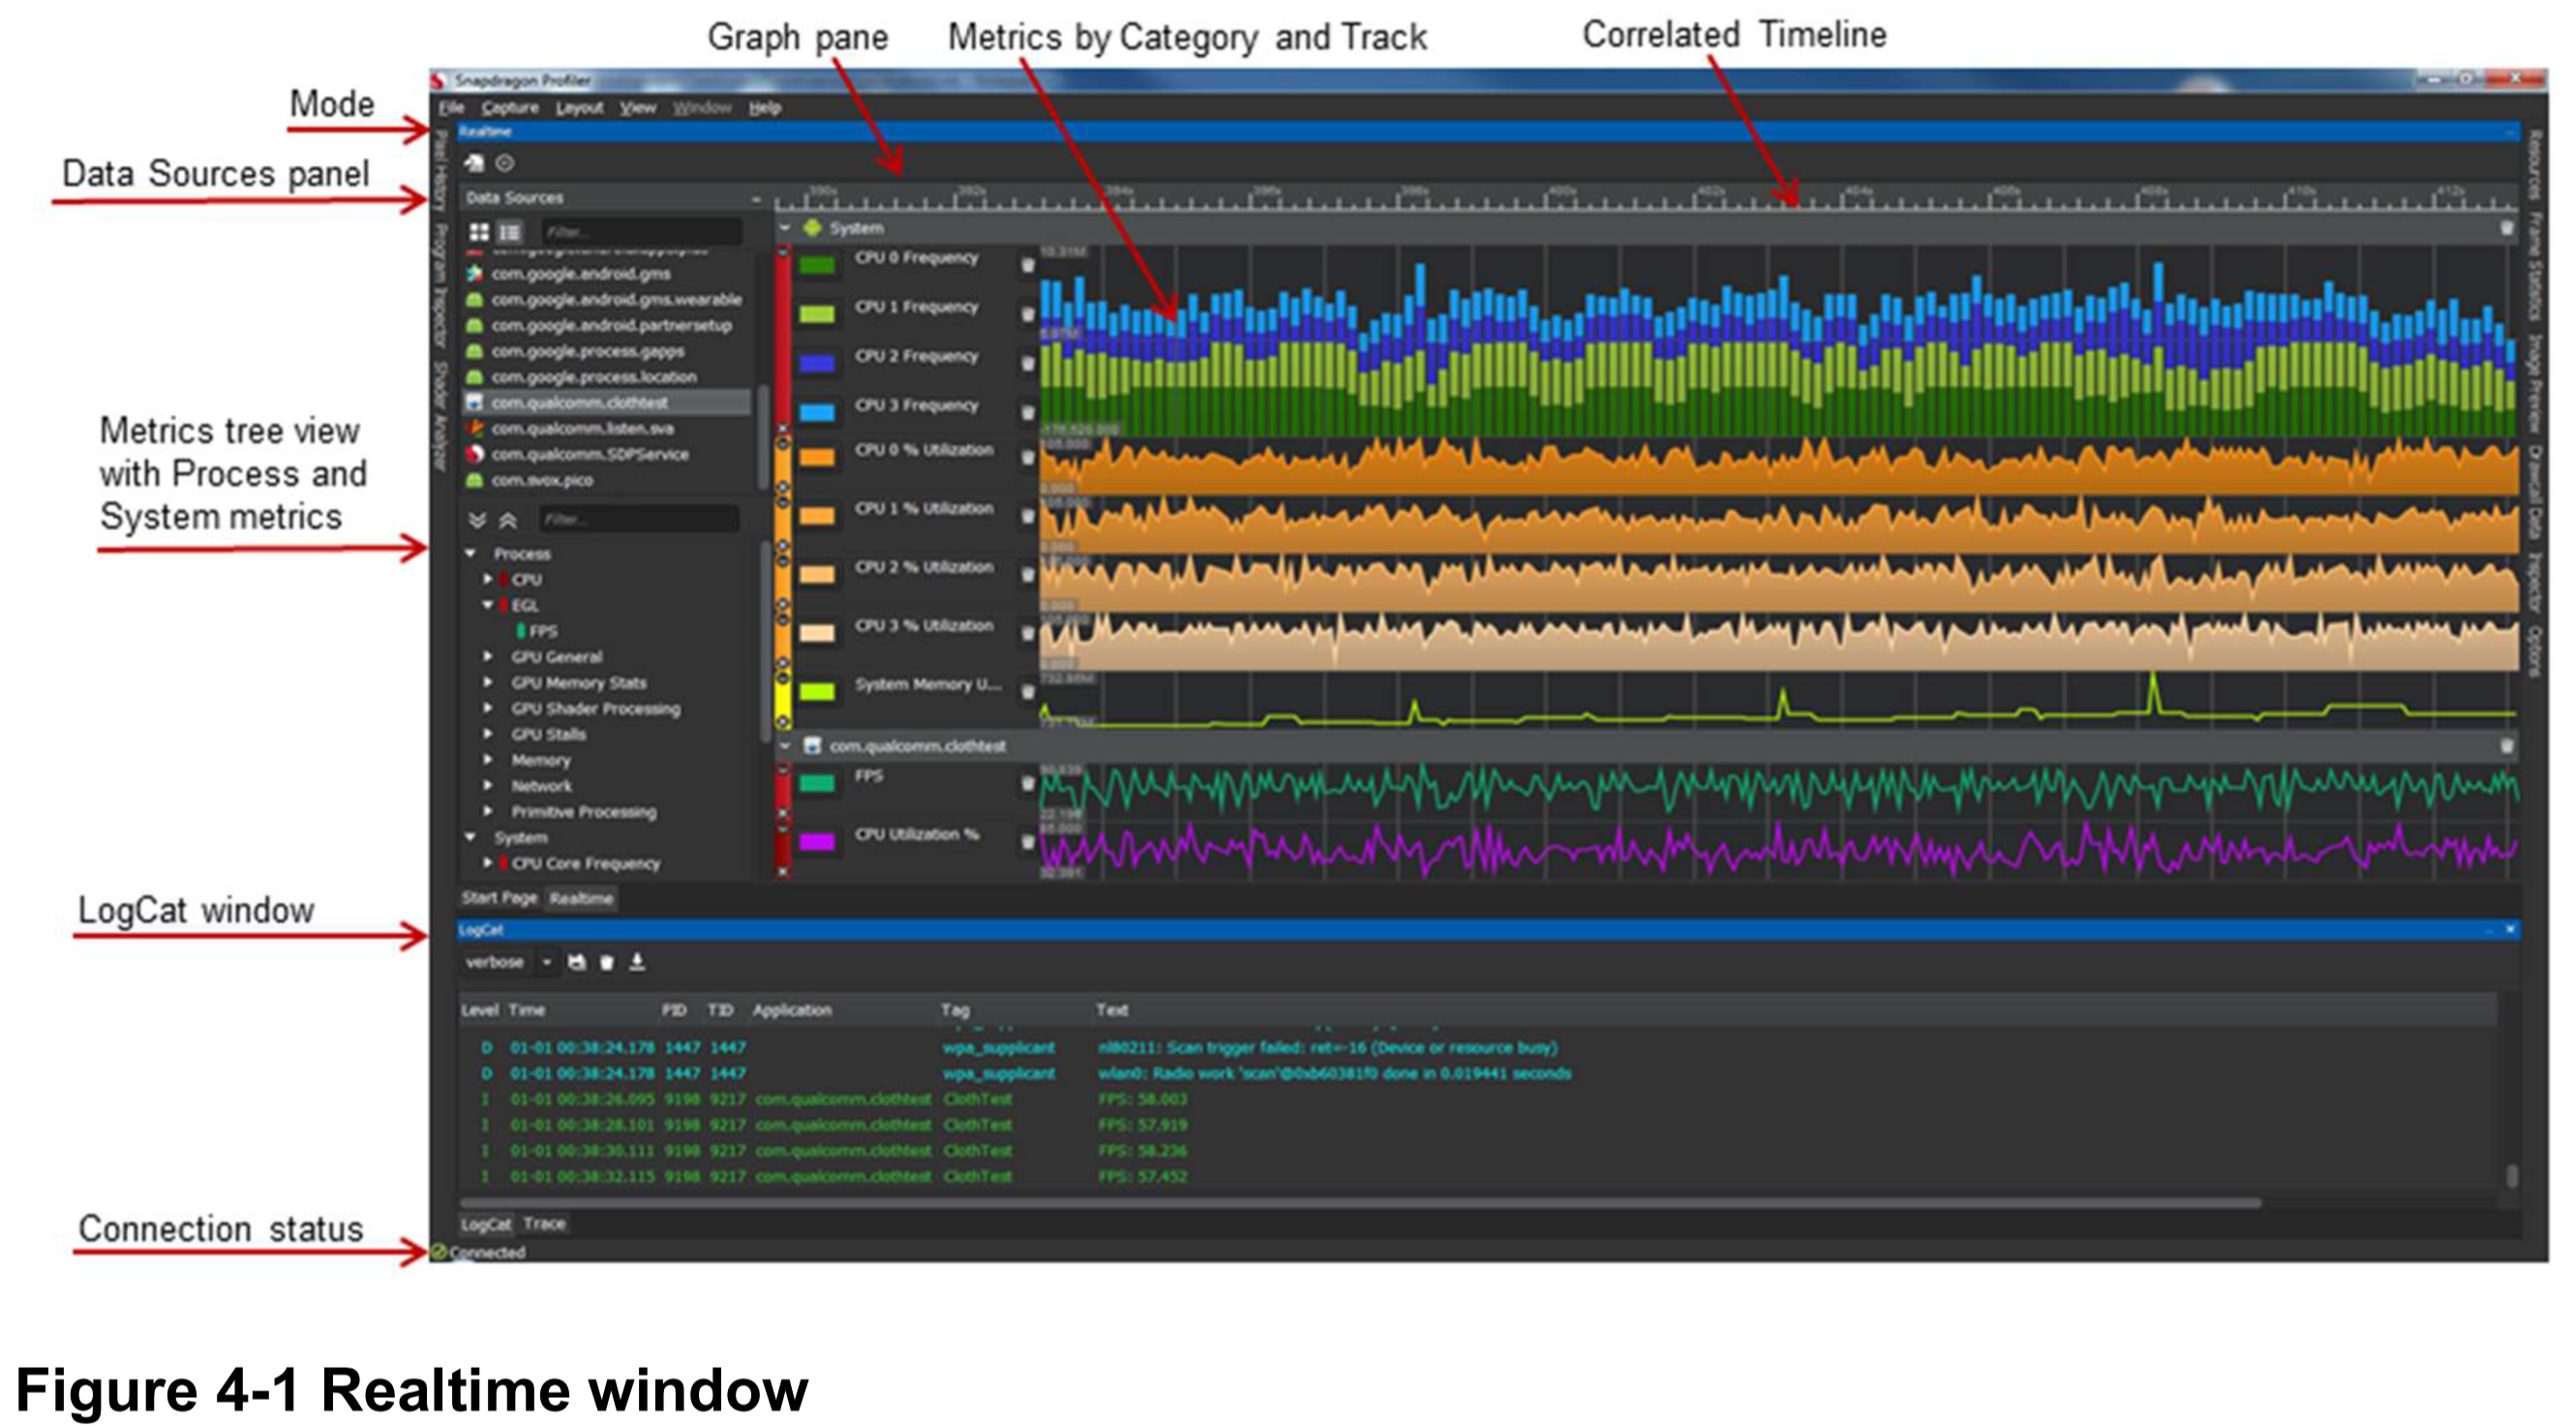
RealTime
Realtime view makes it easy to correlate system resource usage on a timline
Analyze CPU, GPU, DPS*, memory, power, thermal, and network data metrics
Select from over 150 different hardware performance counter in 22 categories
* Requires a Snapdragon 820 (or later) processor
Trace Capture
Trace Capture mode allows you to visualize kernel and system events on a timeline to analyze low-level system events across the CPU, GPU, and DSP. View CPU scheduling and GPU stage data to see where your application is spending its time
Snapshot Capture
Snapshot Capture mode allows you to capture and debug a rendered frame from an OpenGL ES or Vulkan application:
Setup through and replay a rendered frame draw call-by-draw call
View and edit shaders and preview the results on your device (preview for OpenGL ES only)
View and debug pixel history (OpenGL ES only)
Capture and view GPU metrics per draw call
NOTE: Snapdragon Capture mode requires a mobile device with a Qualcomm Snapdragon 805 (or later) processor and Android 6.0 (or later). Snapshot of Vulkan applications requires Android 8.0 (or later)
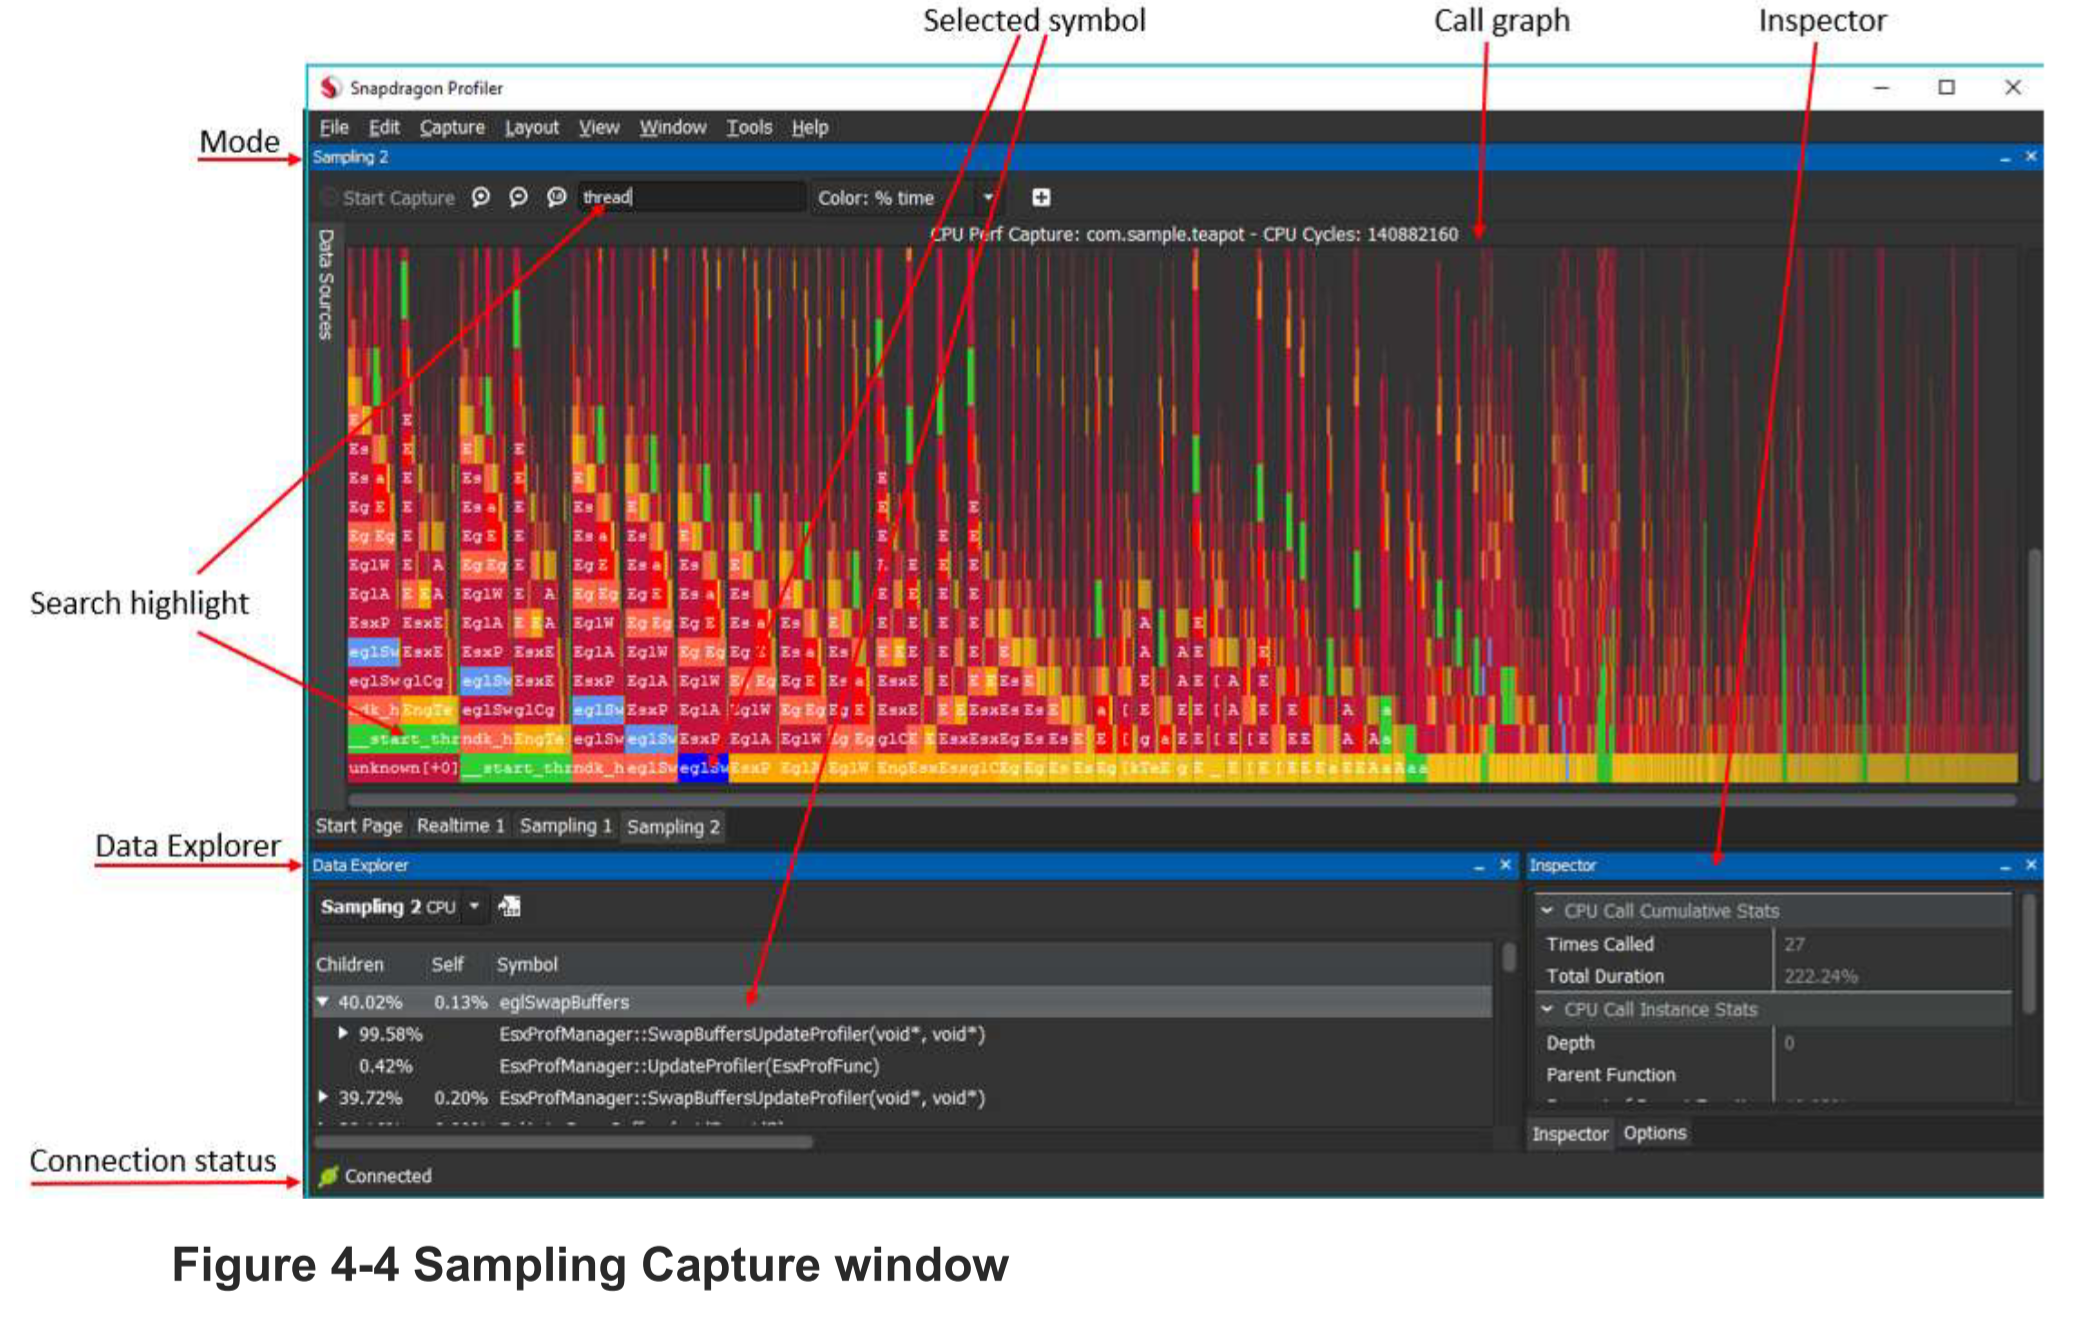
Sampling Capture
Sampling Capture mode allows you to record the call graph for an application to analyze consumed CPU time. The call graph is visualized as a flame graph.
2. System Rquirements

3. Install, Launch, and Content
3.1 Install Snapdragon Profiler
3.1.1 Microsoft Windows installation
3.1.2 Mac OS X installation
3.1.3 Ubuntu Linux installation
3.2 Launch Snapdragon Profiler
3.3 Connect to a device
Snapdragon Profiler auto-detects any devices connected to the computer via ADB, over USB or Wi-Fi, and begins installing the service on the device.
4. User Interface
4.1 Start Page
4.2 Views
4.2.1 Realtime window
4.2.2 Trace Capture window

4.2.3 Snapshot Capture window

4.2.4 Sampling Capture window
4.3 Navigation
5. Data Capture Modes
5.1 Realtime
5.1.1 Realtime basics
5.2 Trace Capture
5.2.1 Additional requirements
5.2.2 Launch applications
5.2.3 Trace Capture basics
5.2.4 Measure DSP performance
5.2.5 Capture OpenCL applications
5.2.6 Capture Vulkan applications
5.2.7 Analytics
5.2.8 Measuring time
5.2.9 Annotations
5.3 Snapshot Capture
5.3.1 Additional requirements
5.3.2 Launch applications
5.3.3 Snapshot Capture basics
5.3.4 Vulkan Snapshot Capture
5.4 Sampling Capture
5.4.1 Additional requirements
5.4.2 Sampling Capture basics
6. Saving Captures
7. Troubleshooting