https://docs.unity3d.com/2018.4/Documentation/Manual/com.unity.performance.profile-analyzer.html
https://docs.unity3d.com/Packages/com.unity.performance.profile-analyzer@0.6/manual/index.html
Profile Analyzer Window
The Profile Analyzer Window contains two views, the Single and Compare views, both of these views visualize frame, thread and marker data from the Unity Profiler window and show min, max, median, mean and lower/upper quartile values over the selected frame range including the distribution of each marker using histogram and box and whisker plots
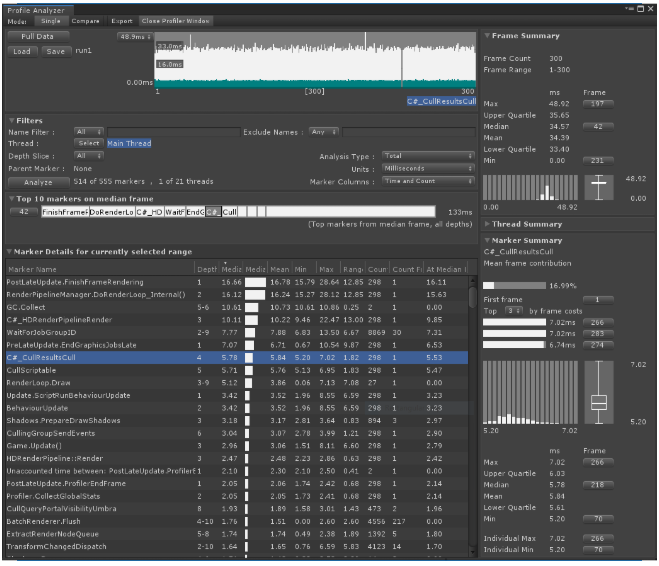
Single View
Frame Control
Filters
Median Frame Top 10 Marker stack
Frame Summary
Thread Summary
Marker Summary
Marker List
Compare View
Frame Control and Range
Selection
Filtering System
Export Dialog
Workflows
Collecting and Viewing Data
Comparing Frames from the Same Data Set
Comparing Frames from Different Data Sets
Ordering Frames by Length
Tips and troubleshooting
What statistics are available?
How are the statistics represented?