注:我是在Centos7上安装的,下面是我的安装过程,对于Ubuntu 15.04+给了对应的参照。
influxdb 安装
wget https://dl.influxdata.com/influxdb/releases/influxdb-1.0.2.x86_64.rpm
yum localinstall influxdb-1.0.2.x8664.rpm
systemctl start influxd
在Ubuntu上
wget https://dl.influxdata.com/influxdb/releases/influxdb_1.0.2_amd64.deb
sudo dpkg -i influxdb_1.2.4_amd64.deb
sudo systemctl start influxdb
telegraf 安装
wget http://get.influxdb.org/telegraf/telegraf-0.11.1-1.x86_64.rpm
yum localinstall telegraf-0.11.1-1.x86_64.rpm
在Ubuntu上
wget https://dl.influxdata.com/telegraf/releases/telegraf_0.11.1-1_amd64.deb
sudo dpkg -i telegraf_0.11.1-1_amd64.deb
sudo systemctl start telegraf
创建 Influxdb数据库
[root@VM_172_102_centos tools]# influx
Visit https://enterprise.influxdata.com to register for updates, InfluxDB server management, and monitoring.
Connected to http://localhost:8086 version 1.0.2
InfluxDB shell version: 1.0.2
> create database telegraf
> show databases
name: databases
---------------
name
_internal
telegraf

> exit
配置Telegraf
[root@VM_172_102_centos tools]# vim /etc/telegraf/telegraf.conf
## 修改内容如下
[[outputs.influxdb]]
  urls = ["http://localhost:8086"]  #infulxdb地址
  database = "telegraf" #数据库
  precision = "s"
  timeout = "5s"
  username = "admin" #帐号
  password = "admin" #密码
  retention_policy = ""

[root@VM_172_102_centos tools]# systemctl restart telegraf
检查Telegraf配置
## 转态是running说明配置加载成功
[root@VM_172_102_centos tools]# service telegraf status
Redirecting to /bin/systemctl status telegraf.service
● telegraf.service - The plugin-driven server agent for reporting metrics into InfluxDB
   Loaded: loaded (/usr/lib/systemd/system/telegraf.service; enabled; vendor preset: disabled)
   Active: active (running) since Tue 2018-03-27 18:50:40 CST; 2s ago
     Docs: https://github.com/influxdata/telegraf
 Main PID: 3243 (telegraf)
   CGroup: /system.slice/telegraf.service
           └─3243 /usr/bin/telegraf -config /etc/telegraf/telegraf.conf -config-directory /etc/telegraf/telegraf.d

Mar 27 18:50:40 VM_172_102_centos systemd[1]: Started The plugin-driven server agent for reporting metrics into InfluxDB.
Mar 27 18:50:40 VM_172_102_centos systemd[1]: Starting The plugin-driven server agent for reporting metrics into InfluxDB...
Mar 27 18:50:40 VM_172_102_centos telegraf[3243]: 2018/03/27 18:50:40 Starting Telegraf (version 0.11.1)
Mar 27 18:50:40 VM_172_102_centos telegraf[3243]: 2018/03/27 18:50:40 Loaded outputs: influxdb
Mar 27 18:50:40 VM_172_102_centos telegraf[3243]: 2018/03/27 18:50:40 Loaded inputs: processes swap system cpu disk diskio kernel mem
Mar 27 18:50:40 VM_172_102_centos telegraf[3243]: 2018/03/27 18:50:40 Tags enabled: host=VM_172_102_centos
Mar 27 18:50:40 VM_172_102_centos telegraf[3243]: 2018/03/27 18:50:40 Agent Config: Interval:10s, Debug:false, Quiet:false, Hostname:"VM_172_102_centos", Flush Interval:10s
Active: failed: 附上由retention policy not found: default引起的配置错误。这里实在的坑,下载后的默认配置是default要改成""。( retention_policy = "")
[root@VM_172_102_centos tools]# service telegraf status
Redirecting to /bin/systemctl status telegraf.service
● telegraf.service - The plugin-driven server agent for reporting metrics into InfluxDB
   Loaded: loaded (/usr/lib/systemd/system/telegraf.service; enabled; vendor preset: disabled)
   Active: failed (Result: exit-code) since Tue 2018-03-27 18:47:56 CST; 5min ago
     Docs: https://github.com/influxdata/telegraf
  Process: 2768 ExecStart=/usr/bin/telegraf -config /etc/telegraf/telegraf.conf -config-directory /etc/telegraf/telegraf.d ${TELEGRAF_OPTS} (code=exited, status=2)
 Main PID: 2768 (code=exited, status=2)

Mar 27 18:47:40 VM_172_102_centos telegraf[2768]: 2018/03/27 18:47:40 ERROR: {"error":"retention policy not found: default"}
Mar 27 18:47:40 VM_172_102_centos telegraf[2768]: 2018/03/27 18:47:40 Error writing to output [influxdb]: Could not write to any InfluxDB server in cluster
Mar 27 18:47:50 VM_172_102_centos telegraf[2768]: 2018/03/27 18:47:50 Gathered metrics, (10s interval), from 8 inputs in 21.135525ms
Mar 27 18:47:50 VM_172_102_centos telegraf[2768]: 2018/03/27 18:47:50 ERROR: {"error":"retention policy not found: default"}
Mar 27 18:47:50 VM_172_102_centos telegraf[2768]: 2018/03/27 18:47:50 Error writing to output [influxdb]: Could not write to any InfluxDB server in cluster
Mar 27 18:47:56 VM_172_102_centos systemd[1]: Stopping The plugin-driven server agent for reporting metrics into InfluxDB...
Mar 27 18:47:56 VM_172_102_centos systemd[1]: telegraf.service: main process exited, code=exited, status=2/INVALIDARGUMENT
Mar 27 18:47:56 VM_172_102_centos systemd[1]: Stopped The plugin-driven server agent for reporting metrics into InfluxDB.
Mar 27 18:47:56 VM_172_102_centos systemd[1]: Unit telegraf.service entered failed state.
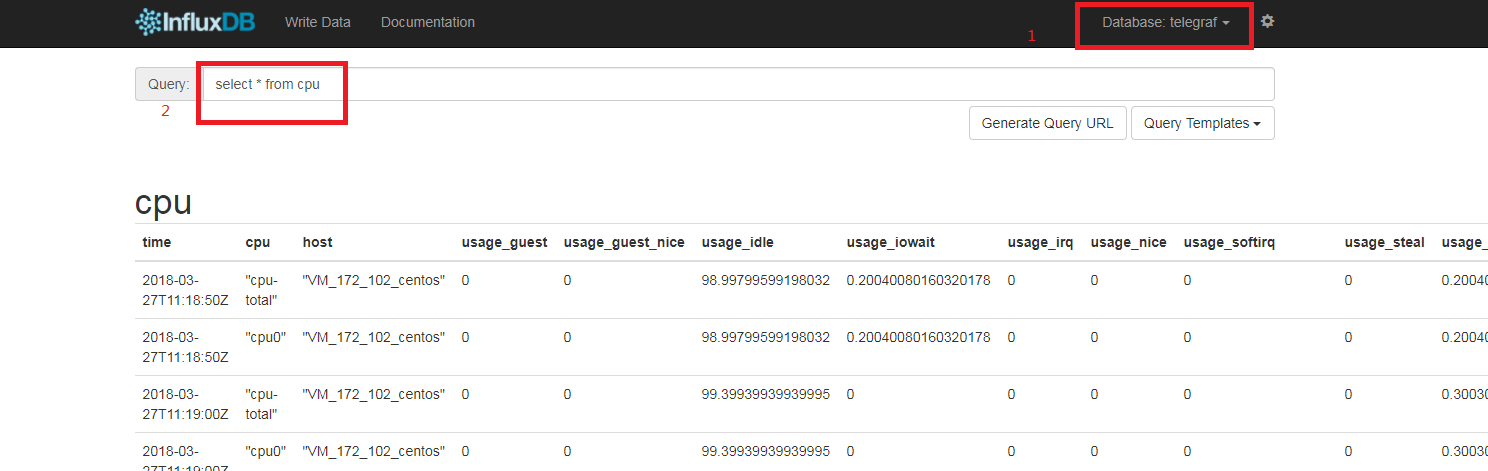
查看数据
打开 Influxdb 查询界面:http://你的ip地址:8083 , 输入查询语句seclect * from cpu可查询到 CPU 相关信息。
安装Grafana
wget https://grafanarel.s3.amazonaws.com/builds/grafana-3.1.1-1470047149.x86_64.rpm
yum install initscripts fontconfig -y
rpm -ivh grafana-3.1.1-1470047149.x86_64.rpm
systemctl start grafana-server
在Ubuntu上
wget https://grafanarel.s3.amazonaws.com/builds/grafana_3.1.1-1470047149_amd64.deb
sudo apt-get install -y adduser libfontconfig
sudo dpkg -i grafana_3.1.1-1470047149_amd64.deb
systemctl start grafana-server
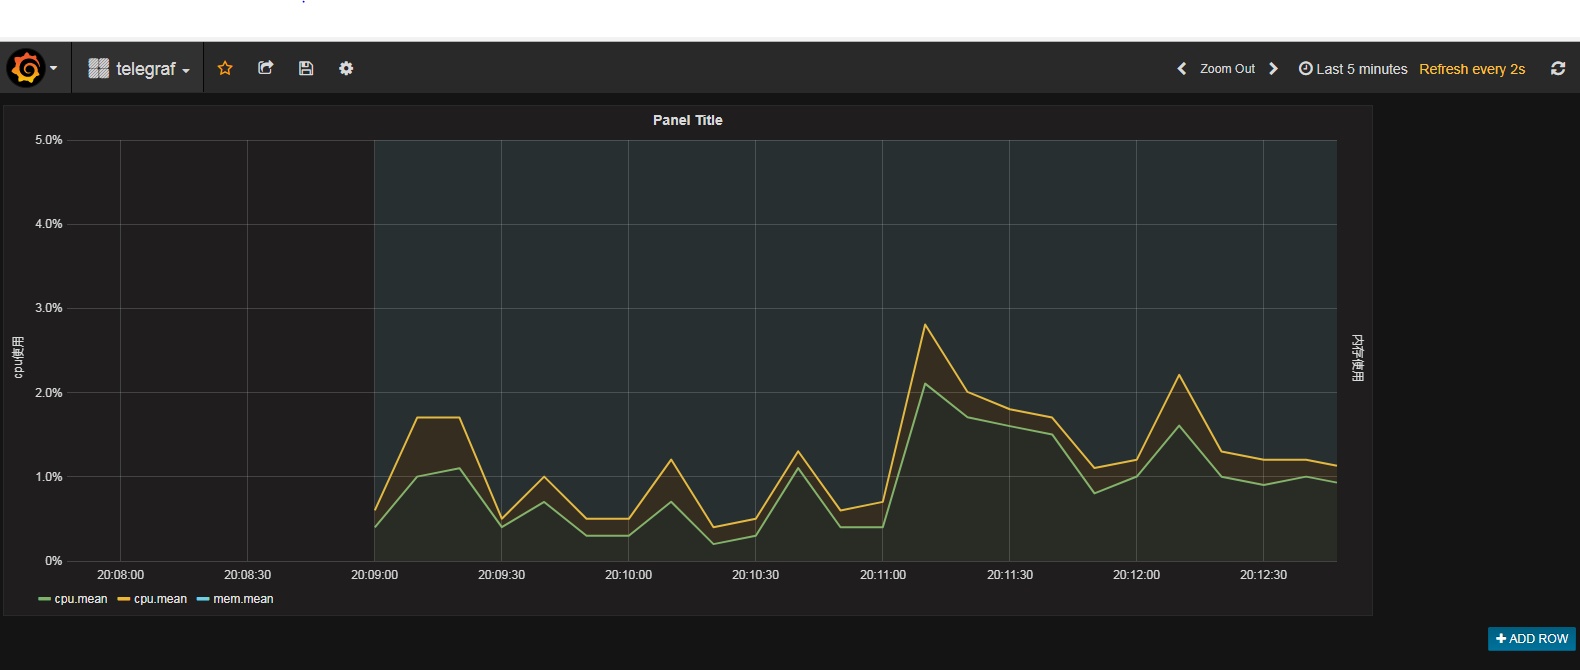
配置Grafana
http://你的ip地址:3000 进入配置窗口配置 (略)