下载地址:https://grafana.com/grafana/download
获取并安装grafana5.2.1
# wget https://s3-us-west-2.amazonaws.com/grafana-releases/release/grafana-5.2.1-1.x86_64.rpm
# yum localinstall -y grafana-5.2.0-1.x86_64.rpm
服务端图像呈现组件安装
yum install fontconfig freetype* urw-fonts -y
开启系统默认启动
systemctl enable grafana-server
启动服务
systemctl start grafana-server
查看服务是否正常启动
systemctl status grafana-server
也可以查看grafana-zabbix-app 库,安装最新的插件:
git安装插件
yum install -y git
cd /var/lib/grafana/plugins
git clone https://github.com/alexanderzobnin/grafana-zabbix-app
使用这样的方法安装,能轻易的升级运行grafnan zabbix插件。
cd /var/lib/grafana/plugins/grafana-zabbix-app
git pull
# 获取钟表插件
git clone https://github.com/grafana/clock-panel.git
service grafana-server restart
# 开启防火墙放行3000端口
firewall-cmd --add-port=3000/tcp --permanent
firewall-cmd --reload
安装饼图插件
cd /var/lib/grafana/plugins
git clone https://github.com/gbrian/grafana-piechart-panel-echart.git
git clone https://github.com/raintank/worldping-app.git
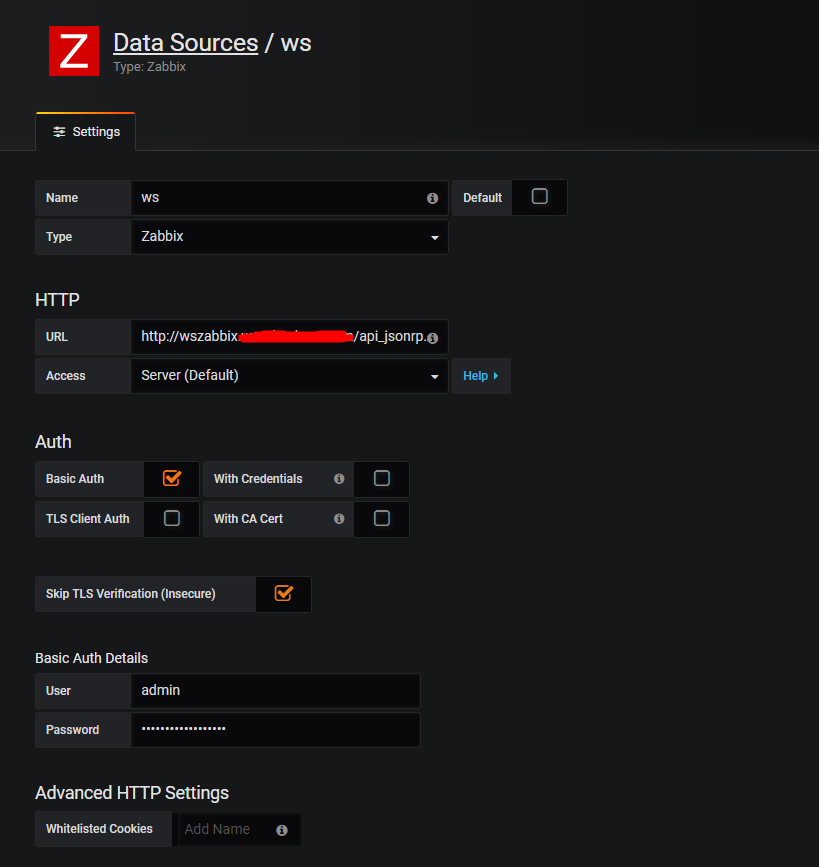
配置:

排错命令:
[root@ws_zabbix4:~]# curl -X POST -d '{"user":"admin","password":"admin"},"id":1}' -H "Content-Type:application/json" http://wszabbix.chinasoft.com/api_jsonrpc.php
<!DOCTYPE HTML PUBLIC "-//IETF//DTD HTML 2.0//EN">
<html>
<head><title>403 Forbidden</title></head>
<body bgcolor="white">
<h1>403 Forbidden</h1>
<p>You don't have permission to access the URL on this server. Sorry for the inconvenience.<br/>
Please report this message and include the following information to us.<br/>
Thank you very much!</p>
<table>
<tr>
<td>URL:</td>
<td>http://wszabbix.chinasoft.com/api_jsonrpc.php</td>
</tr>
<tr>
<td>Server:</td>
<td>ws_zabbix4.0_server</td>
</tr>
<tr>
<td>Date:</td>
<td>2019/08/06 01:21:11</td>
</tr>
</table>
<hr/>Powered by Tengine/2.2.3</body>
</html>
# 没有权限访问