CPU 使用率
Linux 作为一个多任务操作系统,将每个 CPU 的时间划分为很短的时间片,再通过调度器轮流分配给各个任务使用,因此造成多任务同时运行的错觉。为了维护 CPU 时间,Linux 通过事先定义的节拍率(内核中表示为 HZ),触发时间中断,并使用全局变量 Jiffies 记录了开机以来的节拍数。每发生一次时间中断,Jiffies 的值就加 1。节拍率 HZ 是内核的可配选项,可以设置为 100、250、1000 等。不同的系统可能设置不同数值,你可以通过查询 /boot/config 内核选项来查看它的配置值。比如在我的系统中,节拍率设置成了 1000,也就是每秒钟触发 1000 次时间中断。
[root@master ~]# grep 'CONFIG_HZ=' /boot/config-$(uname -r)
CONFIG_HZ=1000
同时,正因为节拍率 HZ 是内核选项,所以用户空间程序并不能直接访问。为了方便用户空间程序,内核还提供了一个用户空间节拍率 USER_HZ,它总是固定为 100,也就是 1/100 秒。这样,用户空间程序并不需要关心内核中 HZ 被设置成了多少,因为它看到的总是固定值 USER_HZ。
Linux 通过 /proc 虚拟文件系统,向用户空间提供了系统内部状态的信息,而 /proc/stat 提供的就是系统的 CPU 和任务统计信息。比方说,如果你只关注 CPU 的话,可以执行下面的命令:
[root@master ~]#  cat /proc/stat | grep ^cpu
cpu  393 0 1464 128155 1437 0 17 0 0 0
cpu0 200 0 849 64076 624 0 6 0 0 0
cpu1 192 0 614 64079 813 0 11 0 0 0
这里的输出结果是一个表格。其中,第一列表示的是 CPU 编号,如 cpu0、cpu1 ,而第一行没有编号的 cpu ,表示的是所有 CPU 的累加。其他列则表示不同场景下 CPU 的累加节拍数,它的单位是 USER_HZ,也就是 10 ms(1/100 秒),所以这其实就是不同场景下的 CPU 时间。当然,这里每一列的顺序并不需要你背下来。你只要记住,有需要的时候,查询 man proc 就可以。不过,你要清楚 man proc 文档里每一列的涵义,它们都是 CPU 使用率相关的重要指标,你还会在很多其他的性能工具中看到它们。
user(通常缩写为 us),代表用户态 CPU 时间。注意,它不包括下面的 nice 时间,但包括了 guest 时间。
nice(通常缩写为 ni),代表低优先级用户态 CPU 时间,也就是进程的 nice 值被调整为 1-19 之间时的 CPU 时间。这里注意,nice 可取值范围是 -20 到 19,数值越大,优先级反而越低。
system(通常缩写为 sys),代表内核态 CPU 时间。
idle(通常缩写为 id),代表空闲时间。注意,它不包括等待 I/O 的时间(iowait)。iowait(通常缩写为 wa),代表等待 I/O 的 CPU 时间。irq(通常缩写为 hi),代表处理硬中断的 CPU 时间。
softirq(通常缩写为 si),代表处理软中断的 CPU 时间。
steal(通常缩写为 st),代表当系统运行在虚拟机中的时候,被其他虚拟机占用的 CPU 时间。
guest(通常缩写为 guest),代表通过虚拟化运行其他操作系统的时间,也就是运行虚拟机的 CPU 时间。
guest_nice(通常缩写为 gnice),代表以低优先级运行虚拟机的时间。
而我们通常所说的 CPU 使用率,就是除了空闲时间外的其他时间占总 CPU 时间的百分比,用公式来表示就是:

根据这个公式,我们就可以从 /proc/stat 中的数据,很容易地计算出 CPU 使用率。当然,也可以用每一个场景的 CPU 时间,除以总的 CPU 时间,计算出每个场景的 CPU 使用率。
跟系统的指标类似,Linux 也给每个进程提供了运行情况的统计信息,也就是 /proc/[pid]/stat。不过,这个文件包含的数据就比较丰富了,总共有 52 列的数据。需要的时候,查 man proc 就行。
各种各样的性能分析工具已经帮我们计算好了。不过要注意的是,性能分析工具给出的都是间隔一段时间的平均 CPU 使用率,所以要注意间隔时间的设置,特别是用多个工具对比分析时,你一定要保证它们用的是相同的间隔时间。
对比一下 top 和 ps 这两个工具报告的 CPU 使用率,默认的结果很可能不一样,因为 top 默认使用 3 秒时间间隔,而 ps 使用的却是进程的整个生命周期。
怎么查看 CPU 使用率
top 和 ps 是最常用的性能分析工具:top 显示了系统总体的 CPU 和内存使用情况,以及各个进程的资源使用情况。ps 则只显示了每个进程的资源使用情况。
top 的输出格式为:
[root@master ~]# top
top - 11:33:25 up  1:25,  2 users,  load average: 0.08, 0.07, 0.06
Tasks: 110 total,   1 running, 109 sleeping,   0 stopped,   0 zombie
%Cpu(s):  0.0 us,  3.0 sy,  0.0 ni, 97.0 id,  0.0 wa,  0.0 hi,  0.0 si,  0.0 st
KiB Mem :  8009556 total,  7306268 free,   209752 used,   493536 buff/cache
KiB Swap:  5242876 total,  5242876 free,        0 used.  7533132 avail Mem

  PID USER      PR  NI    VIRT    RES    SHR S  %CPU %MEM     TIME+ COMMAND
    1 root      20   0  191096   3996   2608 S   0.0  0.0   0:02.75 systemd
    2 root      20   0       0      0      0 S   0.0  0.0   0:00.01 kthreadd
    3 root      20   0       0      0      0 S   0.0  0.0   0:02.44 ksoftirqd/0
    5 root       0 -20       0      0      0 S   0.0  0.0   0:00.00 kworker/0:0H
这个输出结果中,第三行 %Cpu 就是系统的 CPU 使用率,只是把 CPU 时间变换成了 CPU 使用率,我就不再重复讲了。不过需要注意,top 默认显示的是所有 CPU 的平均值,这个时候你只需要按下数字 1 ,就可以切换到每个 CPU 的使用率了。
空白行之后是进程的实时信息,每个进程都有一个 %CPU 列,表示进程的 CPU 使用率。它是用户态和内核态 CPU 使用率的总和,包括进程用户空间使用的 CPU、通过系统调用执行的内核空间 CPU 、以及在就绪队列等待运行的 CPU。在虚拟化环境中,它还包括了运行虚拟机占用的 CPU。
top 并没有细分进程的用户态 CPU 和内核态 CPU,如果想查看详细使用情况;pidstat 它正是一个专门分析每个进程 CPU 使用情况的工具。
[root@master ~]# pidstat 1 5
Linux 3.10.0-957.el7.x86_64 (master) 	2020年03月25日 	_x86_64_	(2 CPU)

11时42分06秒   UID       PID    %usr %system  %guest    %CPU   CPU  Command
11时42分07秒     0      6503    0.00    1.98    0.00    1.98     0  pidstat

11时42分07秒   UID       PID    %usr %system  %guest    %CPU   CPU  Command
11时42分08秒     0      6503    0.99    0.99    0.00    1.98     0  pidstat

11时42分08秒   UID       PID    %usr %system  %guest    %CPU   CPU  Command
11时42分09秒     0      5140    0.00    1.00    0.00    1.00     0  irqbalance
11时42分09秒     0      6503    0.00    1.00    0.00    1.00     0  pidstat

11时42分09秒   UID       PID    %usr %system  %guest    %CPU   CPU  Command
11时42分10秒     0      6503    1.00    1.00    0.00    2.00     0  pidstat

11时42分10秒   UID       PID    %usr %system  %guest    %CPU   CPU  Command
11时42分11秒     0      6503    0.99    0.99    0.00    1.98     0  pidstat

平均时间:   UID       PID    %usr %system  %guest    %CPU   CPU  Command
平均时间:     0      5140    0.00    0.20    0.00    0.20     -  irqbalance
平均时间:     0      6503    0.60    1.19    0.00    1.79     -  pidstat
用户态 CPU 使用率 (%usr);
内核态 CPU 使用率(%system);
运行虚拟机 CPU 使用率(%guest);
等待 CPU 使用率(%wait);
以及总的 CPU 使用率(%CPU)
最后的 Average 部分,还计算了 5 组数据的平均值。
CPU 使用率过高怎么办?
通过 top、ps、pidstat 等工具,能够轻松找到 CPU 使用率较高(比如 100% )的进程。接下来,占用 CPU 的到底是代码里的哪个函数呢?找到它,你才能更高效、更针对性地进行优化。
perf 是 Linux 2.6.31 以后内置的性能分析工具。它以性能事件采样为基础,不仅可以分析系统的各种事件和内核性能,还可以用来分析指定应用程序的性能问题。
使用 perf 分析 CPU 性能问题,两种最常见用法。
第一种常见用法是 perf top,类似于 top,它能够实时显示占用 CPU 时钟最多的函数或者指令,因此可以用来查找热点函数
[root@master ~]# perf top
Samples: 8K of event 'cpu-clock', 4000 Hz, Event count (approx.): 37028427 lost: 0/0 drop: 0/0
Overhead  Shared Object            Symbol
  34.91%  [kernel]                 [k] copy_page
  28.55%  [kernel]                 [k] _raw_spin_unlock_irqrestore
   5.88%  [kernel]                 [k] __do_softirq
   4.80%  [kernel]                 [k] ata_sff_pio_task
   2.02%  libslang.so.2.2.4        [.] SLsmg_write_chars
   1.95%  [kernel]                 [k] tick_nohz_idle_enter
   1.25%  [kernel]                 [k] rcu_idle_exit
   1.01%  [kernel]                 [k] arch_cpu_idle
   0.82%  libc-2.17.so             [.] __memcmp_sse4_1
   0.69%  perf                     [.] rb_next
   0.65%  libslang.so.2.2.4        [.] SLtt_smart_puts
   0.59%  libc-2.17.so             [.] __vsnprintf_chk
   0.59%  libslang.so.2.2.4        [.] SLsmg_set_color
   0.52%  libslang.so.2.2.4        [.] 0x000000000008bb35
   0.45%  libslang.so.2.2.4        [.] 0x000000000008bb1a
   0.45%  perf                     [.] 0x0000000000190db0
   0.40%  libslang.so.2.2.4        [.] 0x000000000008bbca
   0.40%  [kernel]                 [k] __follow_mount_rcu
   0.40%  [kernel]                 [k] __lookup_mnt
   0.40%  [kernel]                 [k] clear_inode
   0.40%  [kernel]                 [k] ima_file_check
   0.40%  [kernel]                 [k] lookup_fast
   0.40%  perf                     [.] 0x00000000001194e4
   0.40%  perf                     [.] 0x000000000018069d
   0.36%  [kernel]                 [k] rebalance_domains
   0.35%  libslang.so.2.2.4        [.] 0x000000000008bc7f
第一行包含三个数据,分别是采样数(Samples)、事件类型(event)和事件总数量(Event count)。比如这个例子中,perf 总共采集了8000 个 CPU 时钟事件,而总事件数则为37028427。另外,采样数需要特别注意。如果采样数过少(比如只有十几个),那下面的排序和百分比就没什么实际参考价值了。
再往下看是一个表格式样的数据,每一行包含四列,分别是:
第一列 Overhead ,是该符号的性能事件在所有采样中的比例,用百分比来表示。
第二列 Shared ,是该函数或指令所在的动态共享对象(Dynamic Shared Object),如内核、进程名、动态链接库名、内核模块名等。
第三列 Object ,是动态共享对象的类型。比如 [.] 表示用户空间的可执行程序、或者动态链接库,而 [k] 则表示内核空间。
最后一列 Symbol 是符号名,也就是函数名。当函数名未知时,用十六进制的地址来表示。
接着再来看第二种常见用法,也就是 perf record 和 perf report。 perf top 虽然实时展示了系统的性能信息,但它的缺点是并不保存数据,也就无法用于离线或者后续的分析。而 perf record 则提供了保存数据的功能,保存后的数据,需要你用 perf report 解析展示。
[root@master ~]# perf record
^C[ perf record: Woken up 2 times to write data ]
[ perf record: Captured and wrote 0.666 MB perf.data (11447 samples) ]

perf report 展示类似于perf top的报告
[root@master ~]# perf report

Samples: 11K of event 'cpu-clock', Event count (approx.): 2861750000
Overhead  Command       Shared Object      Symbol
  99.00%  swapper       [kernel.kallsyms]  [k] native_safe_halt
   0.24%  swapper       [kernel.kallsyms]  [k] _raw_spin_unlock_irqrestore
   0.18%  perf          [kernel.kallsyms]  [k] _raw_spin_unlock_irqrestore
   0.08%  sshd          [kernel.kallsyms]  [k] _raw_spin_unlock_irqrestore
   0.05%  swapper       [kernel.kallsyms]  [k] __do_softirq
   0.05%  xfsaild/dm-0  [kernel.kallsyms]  [k] mpt_put_msg_frame
   0.03%  kworker/1:2   [kernel.kallsyms]  [k] mpt_put_msg_frame
   0.03%  kworker/0:1   [kernel.kallsyms]  [k] ata_sff_pio_task
   0.03%  kworker/1:1   [kernel.kallsyms]  [k] _raw_spin_unlock_irqrestore
   0.02%  perf          libslang.so.2.2.4  [.] SLtt_smart_puts
   0.02%  perf          libslang.so.2.2.4  [.] 0x000000000008bbb7
在实际使用中,我们还经常为 perf top 和 perf record 加上 -g 参数,开启调用关系的采样,方便我们根据调用链来分析性能问题。
Nginx + PHP 的 Web 服务为例,来看看当你发现 CPU 使用率过高的问题后,要怎么使用 top 等工具找出异常的进程,又要怎么利用 perf 找出引发性能问题的函数。
环境准备
机器配置:2 CPU,8GB 内存预先安装 docker、sysstat、perf、ab 等工具;centos7工具安装:yum -y install httpd-tools sysstat perf docker-ce
案例架构图
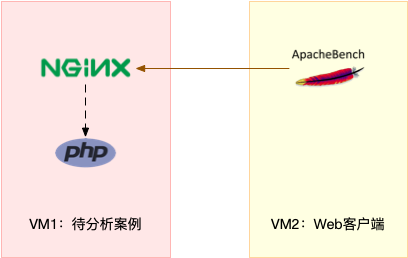
案例环境准
[root@master ~]# docker run --name nginx -p 10000:80 -itd feisky/nginx
Unable to find image 'feisky/nginx:latest' locally
latest: Pulling from feisky/nginx
802b00ed6f79: Pull complete
c16436dbc224: Pull complete
683eac851b28: Pull complete
5bd58d400603: Pull complete
c33cad8d5f27: Pull complete
ae2759a7f424: Pull complete
Digest: sha256:e42fd2b75512353a5b8b5127132d1899f733b62b7c9da6e0d8831ee764888363
Status: Downloaded newer image for feisky/nginx:latest
685aad85627d2ca793ee8cfed8af183e26e7e6a15b02814689d5fd1b9e9b3a34
[root@master ~]# docker run --name phpfpm -itd --network container:nginx feisky/php-fpm
Unable to find image 'feisky/php-fpm:latest' locally
latest: Pulling from feisky/php-fpm
a02fbcf48e6b: Pull complete
0fd90e182cc5: Pull complete
554d282927ec: Pull complete
805a76c208d2: Pull complete
7815988b0b73: Pull complete
5937bbd596b6: Pull complete
eb60d700b9c1: Pull complete
a1fc81bebde7: Pull complete
a4ae4e49d6a5: Pull complete
0eae1384ef62: Pull complete
df27b31cb3fe: Pull complete
Digest: sha256:ddc317fc7e37eea89af3f0dbaa9a9c03484f7c766fbdab6a81ad8e7ead9efa1e
Status: Downloaded newer image for feisky/php-fpm:latest
03ff56a389ffd0cf80288155d098fe4953a6ac66834a9d5fdbc265e79aed805d
测试
[root@master ~]# curl http://192.168.10.16:10000/
It works!
接着,我们来测试一下这个 Nginx 服务的性能。在第二个终端运行下面的 ab 命令:
[root@master ~]# ab -c 10 -n 100 http://192.168.10.16:10000/
This is ApacheBench, Version 2.3 <$Revision: 1430300 $>
Copyright 1996 Adam Twiss, Zeus Technology Ltd, http://www.zeustech.net/
Licensed to The Apache Software Foundation, http://www.apache.org/

Benchmarking 192.168.10.16 (be patient).....done


Server Software:        nginx/1.15.4
Server Hostname:        192.168.10.16
Server Port:            10000

Document Path:          /
Document Length:        9 bytes

Concurrency Level:      10
Time taken for tests:   5.966 seconds
Complete requests:      100
Failed requests:        0
Write errors:           0
Total transferred:      17200 bytes
HTML transferred:       900 bytes
Requests per second:    16.76 [#/sec] (mean)
Time per request:       596.597 [ms] (mean)
Time per request:       59.660 [ms] (mean, across all concurrent requests)
Transfer rate:          2.82 [Kbytes/sec] received

Connection Times (ms)
              min  mean[+/-sd] median   max
Connect:        0    0   0.2      0       1
Processing:   115  564 130.1    578     809
Waiting:      114  564 130.1    578     809
Total:        116  564 130.0    578     809

Percentage of the requests served within a certain time (ms)
  50%    578
  66%    612
  75%    649
  80%    676
  90%    719
  95%    753
  98%    808
  99%    809
 100%    809 (longest request)
从 ab 的输出结果我们可以看到,Nginx 能承受的每秒平均请求数只有16.76。你一定在吐槽,这也太差了吧;这次,第二个终端,将测试的请求总数增加到 10000。这样当你在第一个终端使用性能分析工具时, Nginx 的压力还是继续。
继续在第二个终端,运行 ab 命令:
[root@master ~]# ab -c 10 -n 10000 http://192.168.10.16:10000/
接着,回到第一个终端运行 top 命令,并按下数字 1 ,切换到每个 CPU 的使用率:$ top
top - 12:33:31 up  2:26,  4 users,  load average: 5.38, 3.29, 1.45
Tasks: 126 total,   6 running, 120 sleeping,   0 stopped,   0 zombie
%Cpu0  :100.0 us,  0.0 sy,  0.0 ni,  0.0 id,  0.0 wa,  0.0 hi,  0.0 si,  0.0 st
%Cpu1  : 99.7 us,  0.3 sy,  0.0 ni,  0.0 id,  0.0 wa,  0.0 hi,  0.0 si,  0.0 st
KiB Mem :  8009556 total,  6381804 free,   305240 used,  1322512 buff/cache
KiB Swap:  5242876 total,  5242876 free,        0 used.  7364724 avail Mem

  PID USER      PR  NI    VIRT    RES    SHR S  %CPU %MEM     TIME+ COMMAND
 6980 bin       20   0  336684   9364   1684 R  45.5  0.1   1:43.31 php-fpm
 6982 bin       20   0  336684   9364   1684 R  40.9  0.1   1:41.24 php-fpm
 6979 bin       20   0  336684   9368   1688 R  37.9  0.1   1:43.32 php-fpm
 6981 bin       20   0  336684   9364   1684 R  36.9  0.1   1:40.07 php-fpm
 6978 bin       20   0  336684   9372   1692 R  36.5  0.1   1:41.36 php-fpm
 6774 101       20   0   33092   2152    768 S   0.7  0.0   0:01.94 nginx
 6192 root      20   0  734152  96624  29416 S   0.3  1.2   1:00.15 dockerd
 6717 root      20   0  107684   9220   2800 S   0.3  0.1   0:00.84 containerd-shim
 6976 root      20   0  162004   2296   1620 R   0.3  0.0   0:00.46 top
 6977 root      20   0   58728   3308   2372 S   0.3  0.0   0:00.99 ab
这里可以看到,系统中有几个 php-fpm 进程的 CPU 使用率加起来接近 200%;而每个 CPU 的用户使用率(us)也已经超过了 98%,接近饱和。这样,我们就可以确认,正是用户空间的 php-fpm 进程,导致 CPU 使用率骤升。
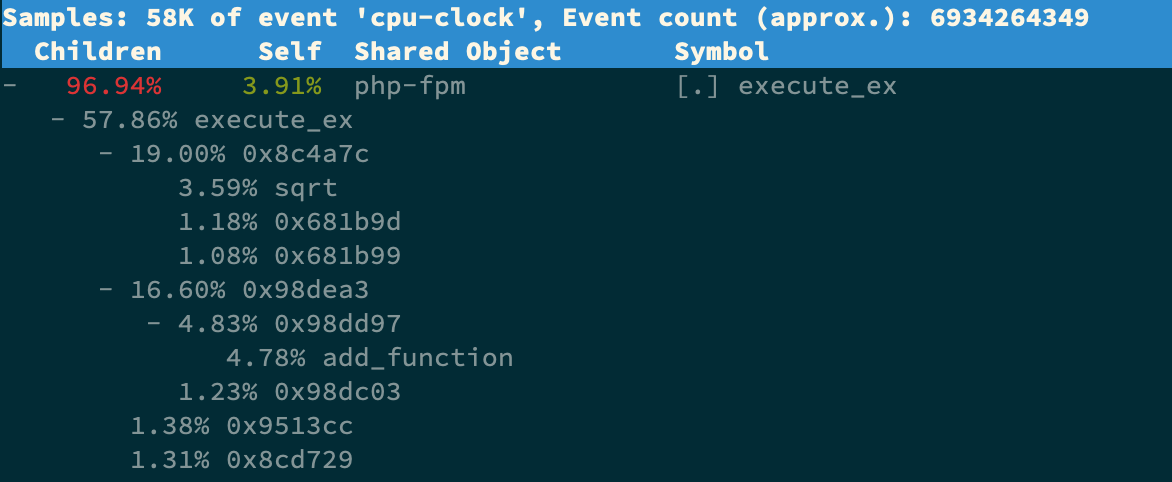
那再往下走,怎么知道是 php-fpm 的哪个函数导致了 CPU 使用率升高呢?我们来用 perf 分析一下。
Samples: 6K of event 'cpu-clock', 4000 Hz, Event count (approx.): 1352913233 lost: 0/0 drop:
  Children      Self  Shared Object       Symbol
+   31.88%     0.00%  [unknown]           [.] 0x6cb6258d4c544155
+   31.88%     0.00%  libc-2.24.so        [.] 0x00007f8f9c6cc2e1
+   31.84%     0.00%  php-fpm             [.] 0x0000555ea3a5d642
+   31.84%     0.00%  php-fpm             [.] 0x0000555ea380e6fc
+   31.84%     0.00%  php-fpm             [.] 0x0000555ea38bdf94
+   31.84%     0.00%  php-fpm             [.] 0x0000555ea3955323
+   29.70%     0.00%  php-fpm             [.] 0x0000555ea395496e
+    6.43%     0.00%  php-fpm             [.] 0x0000555ea3956a7c
+    6.26%     0.00%  php-fpm             [.] 0x0000555ea3a1fea3
+    4.69%     4.69%  libm-2.24.so        [.] 0x000000000002127e
看到16位地址数处理方式
(1)在centos系统上运行 perf record -g ,执行一会儿按ctrl+c停止
(2)把生成的perf.data(通常文件生成在命令执行的当前目录下,当然可以通过find | grep perf.data或 find / -name perf.data查看路径)文件拷贝到容器里面分析:
docker cp perf.data phpfpm:/tpm
docker exec -i -t phpfpm bash
cd /tmp/
apt-get update && apt-get install -y linux-perf linux-tools procps
perf_4.9 report
这样就可以看到函数名了
按方向键切换到 php-fpm,再按下回车键展开 php-fpm 的调用关系,你会发现,调用关系最终到了 sqrt 和 add_function。看来,我们需要从这两个函数入手了。
OK,原来只有 sqrt 函数在 app/index.php 文件中调用了。那最后一步,我们就该看看这个文件的源码了:
[root@master ~]# docker cp phpfpm:/app .
[root@master ~]# grep sqrt -r app/*
app/index.php:  $x += sqrt($x);
[root@master ~]# cat app/index.php
<?php
// test only.
$x = 0.0001;
for ($i = 0; $i <= 1000000; $i++) {
  $x += sqrt($x);
}

echo "It works!"
?>
居然犯了一个这么傻的错误,测试代码没删就直接发布应用了。为了方便你验证优化后的效果,我把修复后的应用也打包成了一个 Docker 镜像,
[root@master ~]# docker rm -f nginx phpfpm
nginx
phpfpm
[root@master ~]# docker run --name nginx -p 10000:80 -itd feisky/nginx:cpu-fix

[root@master ~]# docker run --name phpfpm -itd --network container:nginx feisky/php-fpm:cpu-fix
[root@master ~]# ab -c 10 -n 10000 http://192.168.10.16:10000/
This is ApacheBench, Version 2.3 <$Revision: 1430300 $>
Copyright 1996 Adam Twiss, Zeus Technology Ltd, http://www.zeustech.net/
Licensed to The Apache Software Foundation, http://www.apache.org/

Benchmarking 192.168.10.16 (be patient)
Completed 1000 requests
Completed 2000 requests
Completed 3000 requests
Completed 4000 requests
Completed 5000 requests
Completed 6000 requests
Completed 7000 requests
Completed 8000 requests
Completed 9000 requests
Completed 10000 requests
Finished 10000 requests


Server Software:        nginx/1.15.6
Server Hostname:        192.168.10.16
Server Port:            10000

Document Path:          /
Document Length:        9 bytes

Concurrency Level:      10
Time taken for tests:   3.456 seconds
Complete requests:      10000
Failed requests:        0
Write errors:           0
Total transferred:      1720000 bytes
HTML transferred:       90000 bytes
Requests per second:    2893.26 [#/sec] (mean)
Time per request:       3.456 [ms] (mean)
Time per request:       0.346 [ms] (mean, across all concurrent requests)
Transfer rate:          485.98 [Kbytes/sec] received

Connection Times (ms)
              min  mean[+/-sd] median   max
Connect:        0    0   0.3      0       2
Processing:     1    3   0.9      3      12
Waiting:        1    3   0.9      2      11
Total:          1    3   0.9      3      13
WARNING: The median and mean for the waiting time are not within a normal deviation
        These results are probably not that reliable.

Percentage of the requests served within a certain time (ms)
  50%      3
  66%      4
  75%      4
  80%      4
  90%      4
  95%      5
  98%      6
  99%      6
 100%     13 (longest request)
从这里你可以发现,现在每秒的平均请求数,已经从原来的 16 变成了 2893。你看,就是这么很傻的一个小问题,却会极大的影响性能,并且查找起来也并不容易吧。当然,找到问题后,解决方法就简单多了,删除测试代码就可以了。
CPU 使用率是最直观和最常用的系统性能指标,更是我们在排查性能问题时,通常会关注的第一个指标。所以我们更要熟悉它的含义,尤其要弄清楚用户(%user)、Nice(%nice)、系统(%system) 、等待 I/O(%iowait) 、中断(%irq)以及软中断(%softirq)这几种不同 CPU 的使用率。比如说:用户 CPU 和 Nice CPU 高,说明用户态进程占用了较多的 CPU,所以应该着重排查进程的性能问题。系统 CPU 高,说明内核态占用了较多的 CPU,所以应该着重排查内核线程或者系统调用的性能问题。I/O 等待 CPU 高,说明等待 I/O 的时间比较长,所以应该着重排查系统存储是不是出现了 I/O 问题。软中断和硬中断高,说明软中断或硬中断的处理程序占用了较多的 CPU,所以应该着重排查内核中的中断服务程序。碰到 CPU 使用率升高的问题,你可以借助 top、pidstat 等工具,确认引发 CPU 性能问题的来源;再使用 perf 等工具,排查出引起性能问题的具体函数。