模型使用
使用caffe训练得到的模型进行测试,一般需要如下文件:
1.训练好的caffemodel模型
此处使用lenet_iter_10000.caffemodel。
2.测试网络deploy
可以对lenet_train_test.prototxt做修改。
主要修改的地方包括输入数据,最后的top,权值初始化,第一个卷积层名称不能和训练网络conv1同名。
也可以直接用下面代码生成,对应lenet.
# coding: utf8
from caffe import layers as L,params as P,to_proto
root='C:/Users/jj/Documents/caffe-windows/'
deploy=root+'examples/mnist/deploy.prototxt'    #文件保存路径

def create_deploy():
    #少了第一层,data层
    conv1=L.Convolution(bottom='data', kernel_size=5, stride=1,num_output=20, pad=0,weight_filler=dict(type='xavier'))
    pool1=L.Pooling(conv1, pool=P.Pooling.MAX, kernel_size=2, stride=2)
    conv2=L.Convolution(pool1, kernel_size=5, stride=1,num_output=50, pad=0,weight_filler=dict(type='xavier'))
    pool2=L.Pooling(conv2, pool=P.Pooling.MAX, kernel_size=2, stride=2)
    ip1=L.InnerProduct(pool2, num_output=500,weight_filler=dict(type='xavier'))
    relu1=L.ReLU(ip1, in_place=True)
    ip2 = L.InnerProduct(relu1, num_output=10,weight_filler=dict(type='xavier'))
    #最后没有accuracy层,但有一个Softmax层
    prob=L.Softmax(ip2)
    return to_proto(prob)
def write_deploy():
    with open(deploy, 'w') as f:
        f.write('name:"Lenet"
')
        f.write('input:"data"
')
        f.write('input_dim:1
')
        f.write('input_dim:3
')
        f.write('input_dim:28
')
        f.write('input_dim:28
')
        f.write(str(create_deploy()))
if __name__ == '__main__':
    write_deploy()
3.均值文件
Caffe的C++接口用到的均值文件为binaryproto类型,python接口均值文件为npy类型。
使用python需要将compute_image_mean.exe生成的mean.binaryproto转换成mean.npy。
SET GLOG_logtostderr=1
Buildx64Releasecompute_image_mean.exe examples/mnist/mnist_train_lmdb examples/mnist/number.binaryproto
pause
# coding: utf8
import numpy as np
import caffe

caffe_root = 'C:/Users/jj/Documents/caffe-windows/'  # 路径
MEAN_PROTO_PATH = (caffe_root+'examples/mnist/number.binaryproto' )             # 待转换的pb格式图像均值文件路径
MEAN_NPY_PATH = (caffe_root+'examples/mnist/number_mean.npy')                         # 转换后的numpy格式图像均值文件路径

blob = caffe.proto.caffe_pb2.BlobProto()           # 创建protobuf blob
data = open(MEAN_PROTO_PATH, 'rb' ).read()         # 读入mean.binaryproto文件内容
blob.ParseFromString(data)                         # 解析文件内容到blob

array = np.array(caffe.io.blobproto_to_array(blob))# 将blob中的均值转换成numpy格式,array的shape (mean_number,channel, hight, width)
mean_npy = array[0]                                # 一个array中可以有多组均值存在,故需要通过下标选择其中一组均值
np.save(MEAN_NPY_PATH ,mean_npy)
由于训练中实际并没有用到均值文件,可以直接生成全为0的或者不用。
import numpy as np
n=np.zeros((28,28,1),dtype=np.float32)
np.save('number.npy',n)
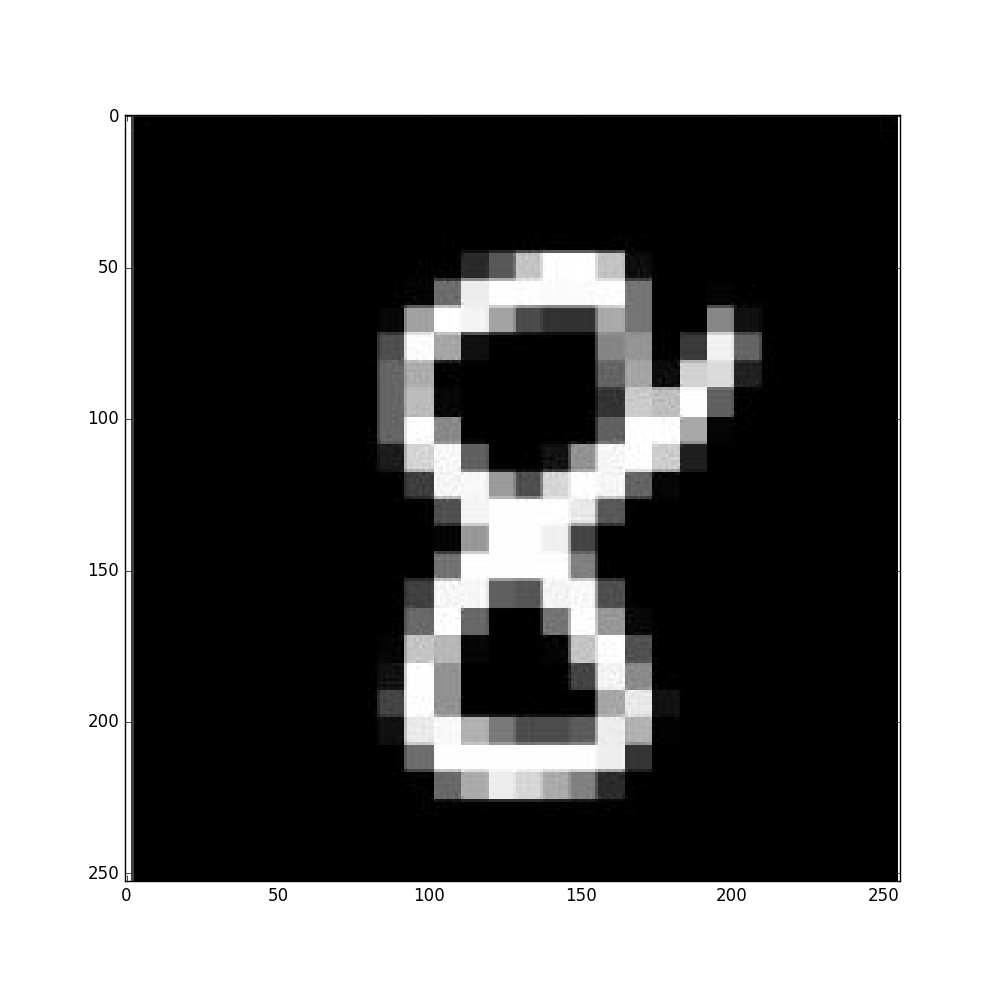
4.测试图片
随便截的一张图。
也可以用数据生成(28*28),对尺寸没有要求。
import numpy as np
from PIL import Image
import cPickle


f=open('mnist.pkl','rb')
a,b,c=cPickle.load(f)
r=a[0][10]
g=np.reshape(r,(28,28))
g=g*255
g=np.array(g)
x=Image.fromarray(g)
if x.mode != 'RGB':
    x = x.convert('RGB')
x.save('n.jpg')
特征提取
教程来自http://nbviewer.jupyter.org/github/BVLC/caffe/blob/master/examples/00-classification.ipynb
根据网页中的教程,略作修改。
下面代码分两部分,分类无误可以再进行特征提取。
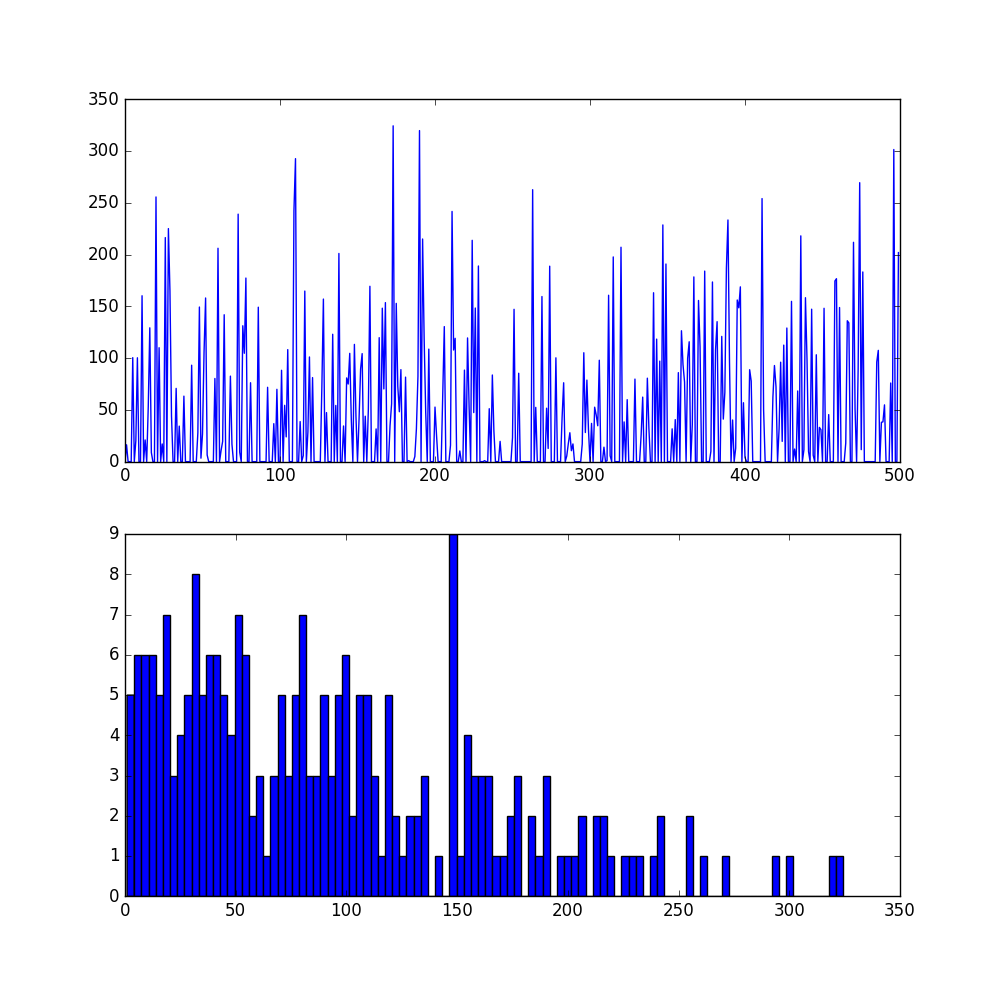
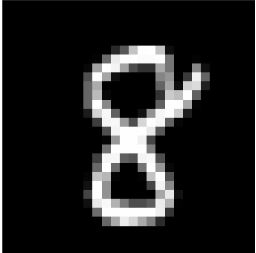
# set up Python environment: numpy for numerical routines, and matplotlib for plotting
import numpy as np
import matplotlib.pyplot as plt

GPU=1

# display plots in this notebook
# set display defaults
plt.rcParams['figure.figsize'] = (10, 10)        # large images
plt.rcParams['image.interpolation'] = 'nearest'  # don't interpolate: show square pixels
plt.rcParams['image.cmap'] = 'gray'  # use grayscale output rather than a (potentially misleading) color heatmap

# The caffe module needs to be on the Python path;
#  we'll add it here explicitly.
import sys
caffe_root = 'C:/Users/jj/Documents/caffe-windows/'  # this file should be run from {caffe_root}/examples (otherwise change this line)
# sys.path.insert(0, caffe_root + 'python')   #  no need for win.

import caffe
# If you get "No module named _caffe", either you have not built pycaffe or you have the wrong path.
import os
if os.path.isfile(caffe_root + 'models/bvlc_reference_caffenet/bvlc_reference_caffenet.caffemodel'):
    print 'CaffeNet found.'
else:
    print 'Downloading pre-trained CaffeNet model...'
    #../scripts/download_model_binary.py ../models/bvlc_reference_caffenet
if GPU:
    caffe.set_device(0)  # if we have multiple GPUs, pick the first one
    caffe.set_mode_gpu()
else:
    caffe.set_mode_cpu()

model_def = caffe_root + 'examples/mnist/deploy.prototxt'    #  deploy.prototxt'  lenet_train_test_d2.prototxt
model_weights = caffe_root + 'examples/mnist/lenet_iter_10000.caffemodel'

net = caffe.Net(model_def,      # defines the structure of the model
                model_weights,  # contains the trained weights
                caffe.TEST)     # use test mode (e.g., don't perform dropout)

# load the mean ImageNet image (as distributed with Caffe) for subtraction
#mu = np.load(caffe_root + 'examples/mnist/m.npy')
#mu = mu.mean(1).mean(1)  # average over pixels to obtain the mean (BGR) pixel values
# print 'mean-subtracted values:', zip('BGR', mu)

# create transformer for the input called 'data'
transformer = caffe.io.Transformer({'data': net.blobs['data'].data.shape})

transformer.set_transpose('data', (2,0,1))  # move image channels to outermost dimension
#transformer.set_mean('data', mu)            # subtract the dataset-mean value in each channel
transformer.set_raw_scale('data', 255)      # rescale from [0, 1] to [0, 255]
#transformer.set_channel_swap('data', (2,1,0))  # swap channels from RGB to BGR

# set the size of the input (we can skip this if we're happy
#  with the default; we can also change it later, e.g., for different batch sizes)
#  net.blobs['data'].reshape(50,        # batch size
#                          1,         # 3-channel (BGR) images
#                          227, 227)  # image size is 227x227

image = caffe.io.load_image(caffe_root + 'examples/images/8.jpg',color=False)
transformed_image = transformer.preprocess('data', image)
plt.imshow(image[:,:,0])   # 28,28,1 to 28,28  [,'gray'] already set
plt.show()

# copy the image data into the memory allocated for the net
net.blobs['data'].data[...] = transformed_image

### perform classification
output = net.forward()

output_prob = output['Softmax1'][0]  # the output probability vector for the first image in the batch
print 'predicted class is:', output_prob.argmax()

if 1 :
    # load ImageNet labels
    labels_file = caffe_root + 'data/mnist/mnist_words.txt'
    if not os.path.exists(labels_file):
        print 0
        # !../ data / ilsvrc12 / get_ilsvrc_aux.sh

    labels = np.loadtxt(labels_file, str, delimiter='	')

    print 'output label:', labels[output_prob.argmax()]

    # sort top five predictions from softmax output
    top_inds = output_prob.argsort()[::-1][:5]  # reverse sort and take five largest items

    print 'probabilities and labels:', zip(output_prob[top_inds], labels[top_inds])


    # for each layer, show the output shape
    for layer_name, blob in net.blobs.iteritems():
        print layer_name + '	' + str(blob.data.shape)

    for layer_name, param in net.params.iteritems():
        print layer_name + '	' + str(param[0].data.shape), str(param[1].data.shape)


    def vis_square(data):
        """Take an array of shape (n, height, width) or (n, height, width, 3)
           and visualize each (height, width) thing in a grid of size approx. sqrt(n) by sqrt(n)"""

        # normalize data for display
        data = (data - data.min()) / (data.max() - data.min())

        # force the number of filters to be square
        n = int(np.ceil(np.sqrt(data.shape[0])))
        padding = (((0, n ** 2 - data.shape[0]),
                    (0, 1), (0, 1))  # add some space between filters
                   + ((0, 0),) * (data.ndim - 3))  # don't pad the last dimension (if there is one)
        data = np.pad(data, padding, mode='constant', constant_values=1)  # pad with ones (white)

        # tile the filters into an image
        data = data.reshape((n, n) + data.shape[1:]).transpose((0, 2, 1, 3) + tuple(range(4, data.ndim + 1)))
        data = data.reshape((n * data.shape[1], n * data.shape[3]) + data.shape[4:])

        if len(data.shape)==3:
            plt.imshow(data[:,:,0])
        else:
            plt.imshow(data)
        plt.axis('off')
        plt.show()

    # the parameters are a list of [weights, biases]
    filters = net.params['Convolution1'][0].data
    vis_square(filters.transpose(0, 2, 3, 1))

    feat = net.blobs['Convolution1'].data[0, :36]
    vis_square(feat)

    feat = net.blobs['Pooling1'].data[0]
    vis_square(feat)

    feat = net.blobs['InnerProduct1'].data[0]
    plt.subplot(2, 1, 1)
    plt.plot(feat.flat)
    plt.subplot(2, 1, 2)
    _ = plt.hist(feat.flat[feat.flat > 0], bins=100)
    feat = net.blobs['Softmax1'].data[0]
    plt.figure(figsize=(15, 3))
    plt.plot(feat.flat)
    plt.show()