参考:
http://domainwebcenter.com/?p=936
http://www.sitepoint.com/debugging-and-profiling-php-with-xdebug/
环境:
Windows 7
IIS 8 Express
Netbeans 8.1
PHP 5.5.11
Xdebug
Xdebug 的下载安装很简单.
你写一个页面得到 phpinfo() 返回的内容. 把生成的 HTML 源代码拷贝到 Xdebug 给你提供的表单中然后提交, Xdebug 会根据你的 PHP 版本匹配一个对应的 Xdebug .DLL 或者 .SO 让你下载并告诉你应该安装到 PHP 对应的位置, 以及一些基本的配置.
需要注意的是: Xdebug 与其他的 zend 插件不兼容. 要去 php.ini 中把其他 zend 插件禁用.
1.
Netbeans 新建PHP项目. 略.
2.
右击项目 -> Properties -> Run Configuration:
Hostname:192.168.1.101 /* 这是我 ipconfig 得到的本机地址. 当然用 localhost 也行 */
Port: 21009
-> 点击 OK
另外: 我没有单独下载 PHP 的安装包, 我的 PHP 是 IIS 自带的. 因此在 Netbeans 中 PHP 项目的服务器配置如下:
右击项目 -> Properties -> Run Configuration -> Run As:
配置为 PHP Build-in Web Server (running on build-in web server) , 也就是 IIS
3.
Tools -> Options -> PHP -> Debugging:
Debugger Port: 9088 /* php.ini 中的 xdebug.remote_port, 我没有用默认的 9000 因为貌似容易出现被占用的情况. 反正随便用一个不是9000的. */
Session ID: netbeans-xdebug /* php.ini 中的 xdebug.idekey */
Stop at First Line: Check
Show Requested URLs: Check
其他选项: Unchecked
-> 点击 OK
4.
在 php.ini 中添加如下代码:
1 [zend]
2 zend_extension = "C:Program Files (x86)iis expressPHPv5.5extphp_xdebug-2.4.0rc3-5.5-vc11-nts.dll"
3 xdebug.remote_enable=1
4 xdebug.remote_host=192.168.1.101
5 xdebug.remote_port=9088
6 xdebug.remote_handler="dbgp"
7 xdebug.idekey="netbeans-xdebug"
注意: xdebug.remote_port 以及 xdebug.idekey 要与 Netbeans PHP Debugging 设置匹配.
这几个选项的含义(摘自参考 Xdebug 的官方文档, 必要的地方我就用自己的话来阐述)
zend_extension: 当然是 xdebug 插件的位置. 也就是你下载的 Xdebug DLL 或者 SO 文件的地址.
xdebug.remote_enable
This switch controls whether Xdebug should try to contact a debug client which is listening on the host and port as set with the settings xdebug.remote_host and xdebug.remote_port. If a connection can not be established the script will just continue as if this setting was 0.
xdebug.remote_host: 你要调试的网站的地址, 根据我的网站的配置, 就是: 192.168.1.101
xdebug.remote_port: IDE (这里是 Netbeans) 监听的端口, 根据Netbeans的配置, 就是: 9088
xdebug.remote_handler
Type: string, Default value: dbgp
Can be either 'php3' which selects the old PHP 3 style debugger output, 'gdb' which enables the GDB like debugger interface or 'dbgp' - the debugger protocol. The DBGp protocol is the only supported protocol.
xdebug.idekey: 总之跟 Netbeans 里面的设置相同即可.
5.
测试.
5.1
测试 Xdebug 是否正确安装
写一个获取 phpinfo() 的页面.
phpinfo.php
 1 <!DOCTYPE html>
 2 <html lang="en">
 3     <head>
 4         <meta charset="utf-8" />
 5         <title>PHP info</title>
 6     </head>
 7     <body>
 8         <?php phpinfo() ?>
 9     </body>
10 </html>
在 Netbeans 中选择 Run -> Run Project
在浏览器中打开 phpinfo.php 页面
页面内搜索 xdebug
如果成功安装, 如下, 可以看到 xdebug 的配置信息:

5.2
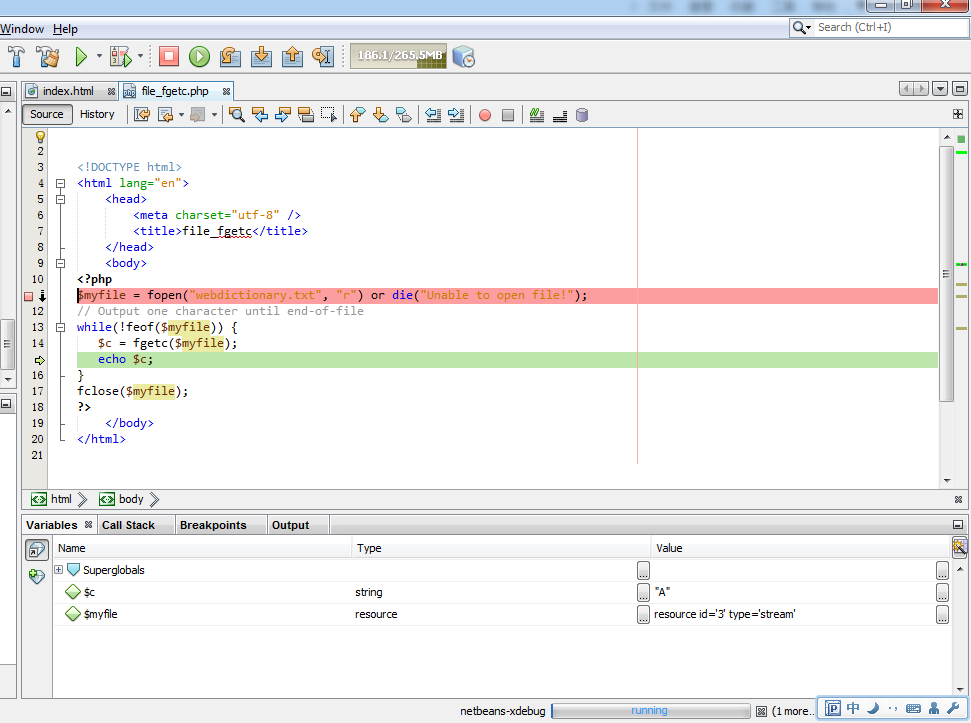
调试
Netbeans 打开文件 file_fgetc.php
 1 <!DOCTYPE html>
 2 <html lang="en">
 3     <head>
 4         <meta charset="utf-8" />
 5         <title>file_fgetc</title>
 6     </head>
 7     <body>
 8 <?php
 9 $myfile = fopen("webdictionary.txt", "r") or die("Unable to open file!");
10 // Output one character until end-of-file
11 while(!feof($myfile)) {
12    $c = fgetc($myfile);
13    echo $c;
14 }
15 fclose($myfile);
16 ?>
17     </body>
18 </html>
Netbeans -> Debug -> Debug File
(我可能是因为网络还是什么问题, 启动 Debug 的时候 Xdebug 与 Netbeans 要花个几秒钟才能连接上, 显示"Waiting for connection (netbeans-xdebug)", 稍微等几秒钟就连上了)
调试界面如下:
注意在调试PHP页面的时候, 会加上参数: XDEBUG_SESSION_START=netbeans-xdebug
如下:

所以, 如果你用的是, Debug -> Debug Project (而不是 Debug File), 然后从 index.html 找到某个 php 页面链接, 发现该 php 页面没有被调试, 就是因为没有加上XDEBUG_SESSION_START参数, 你手动加上再刷新页面即可. XDEBUG_SESSION_START的值就是 php.ini 中 xdebug.idekey 的值.