首先安装firebug,在firefox的扩展里搜索安装即可。
然后在页面中启用firebug中的脚本:

然后在网页某些位置加入debugger命令,比如如下页面代码:
<!DOCTYPE html>
<html>
<head>
<meta charset="utf-8" />
<title>js弹出新窗口</title>
<script type="text/javascript">
    function open_new(obj){
        debugger;
        window.open(obj.href,'search','width=400,height=300,left=500,top=500,scrollbars,resizable');
    }
</script>
</head>
<body>
    <a href="http://www.baidu.com" onclick="open_new(this);return false;">
    go to baidu to search!
</a>
</body>
</html>
在鼠标单击链接时,会执行open_new()函数,而该函数中含有debugger命令,所以会在这个地方中断下来。你可以停下来查看一些变量的值,或选择继续执行。
debugger也可以在断点处查看参数的值:(谷歌浏览器下查看---谷歌浏览器更方便调试)
例如:
function beforeRemove(treeId, treeNode) {
    debugger
    if(confirm("确认删除?")){
        if(treeNode.isParent){
            alert("不能删除非叶子节点");
            return false;
        }
        return true;
    }
}
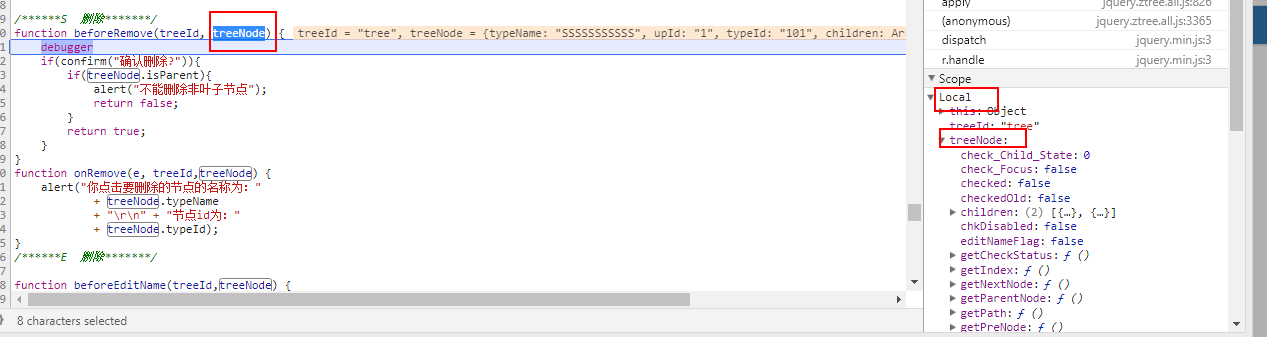
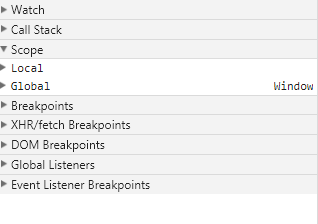
停住之后可以在开发者工具右边的scope区域查看局部变量与全局变量。