引言
直方图是一种对数据分布的描述,在图像处理中,直方图概念非常重要,应用广泛,如图像对比度增强(直方图均衡化),图像信息量度量(信息熵),图像配准(利用两张图像的互信息度量相似度)等。
1、numpy中histogram()函数用于统计一个数据的分布
numpy.histogram(a, bins=10, range=None, normed=None, weights=None, density=None)
Compute the histogram of a set of data.
| Parameters: |
- a : array_like
-
Input data. The histogram is computed over the flattened array.
- bins : int or sequence of scalars or str, optional
-
If bins is an int, it defines the number of equal-width bins in the given range (10, by default). If bins is a sequence, it defines a monotonically increasing array of bin edges, including the rightmost edge, allowing for non-uniform bin widths.
If bins is a string, it defines the method used to calculate the optimal bin width, as defined by histogram_bin_edges.
- range : (float, float), optional
-
The lower and upper range of the bins. If not provided, range is simply (a.min(), a.max()). Values outside the range are ignored. The first element of the range must be less than or equal to the second. range affects the automatic bin computation as well. While bin width is computed to be optimal based on the actual data within range, the bin count will fill the entire range including portions containing no data.
- normed : bool, optional
-
Deprecated since version 1.6.0.
This is equivalent to the density argument, but produces incorrect results for unequal bin widths. It should not be used.
Changed in version 1.15.0: DeprecationWarnings are actually emitted.
- weights : array_like, optional
-
An array of weights, of the same shape as a. Each value in a only contributes its associated weight towards the bin count (instead of 1). If density is True, the weights are normalized, so that the integral of the density over the range remains 1.
- density : bool, optional
-
If False, the result will contain the number of samples in each bin. If True, the result is the value of the probability density function at the bin, normalized such that the integral over the range is 1. Note that the sum of the histogram values will not be equal to 1 unless bins of unity width are chosen; it is not a probability mass function.
Overrides the normed keyword if given.
|
|---|
| Returns: |
- hist : array
-
The values of the histogram. See density and weights for a description of the possible semantics.
- bin_edges : array of dtype float
-
Return the bin edges (length(hist)+1).
|
|---|
Notes
All but the last (righthand-most) bin is half-open. In other words, if bins is:
then the first bin is [1, 2) (including 1, but excluding 2) and the second [2, 3). The last bin, however, is [3, 4], whichincludes 4.(是左闭右开的)
注意:函数将输入数据视为一个整体进行直方图计算,输入是一个flattened aray(输入是个多维的也可以), 返回直方图(array形式)及bin(array)
2、numpy中histogram2d()函数用于统计两个数据的联合分布(可用于计算互信息)
numpy.histogram2d(x, y, bins=10, range=None, normed=None, weights=None, density=None)[source]
Compute the bi-dimensional histogram of two data samples.
| Parameters: |
- x : array_like, shape (N,)
-
An array containing the x coordinates of the points to be histogrammed.
- y : array_like, shape (N,)
-
An array containing the y coordinates of the points to be histogrammed.
- bins : int or array_like or [int, int] or [array, array], optional
-
The bin specification:
- If int, the number of bins for the two dimensions (nx=ny=bins).
- If array_like, the bin edges for the two dimensions (x_edges=y_edges=bins).
- If [int, int], the number of bins in each dimension (nx, ny = bins).
- If [array, array], the bin edges in each dimension (x_edges, y_edges = bins).
- A combination [int, array] or [array, int], where int is the number of bins and array is the bin edges.
- range : array_like, shape(2,2), optional
-
The leftmost and rightmost edges of the bins along each dimension (if not specified explicitly in the bins parameters): [[xmin, xmax], [ymin, ymax]]. All values outside of this range will be considered outliers and not tallied in the histogram.
- density : bool, optional
-
If False, the default, returns the number of samples in each bin. If True, returns the probability density function at the bin, bin_count / sample_count / bin_area.
- normed : bool, optional
-
An alias for the density argument that behaves identically. To avoid confusion with the broken normed argument to histogram, density should be preferred.
- weights : array_like, shape(N,), optional
-
An array of values w_i weighing each sample (x_i, y_i). Weights are normalized to 1 if normed is True. If normed is False, the values of the returned histogram are equal to the sum of the weights belonging to the samples falling into each bin.
|
|---|
| Returns: |
- H : ndarray, shape(nx, ny)
-
The bi-dimensional histogram of samples x and y. Values in x are histogrammed along the first dimension and values in y are histogrammed along the second dimension.
- xedges : ndarray, shape(nx+1,)
-
The bin edges along the first dimension.
- yedges : ndarray, shape(ny+1,)
-
The bin edges along the second dimension.
|
|---|
3、pytorch中计算张量直方图的函数:torch.histc()
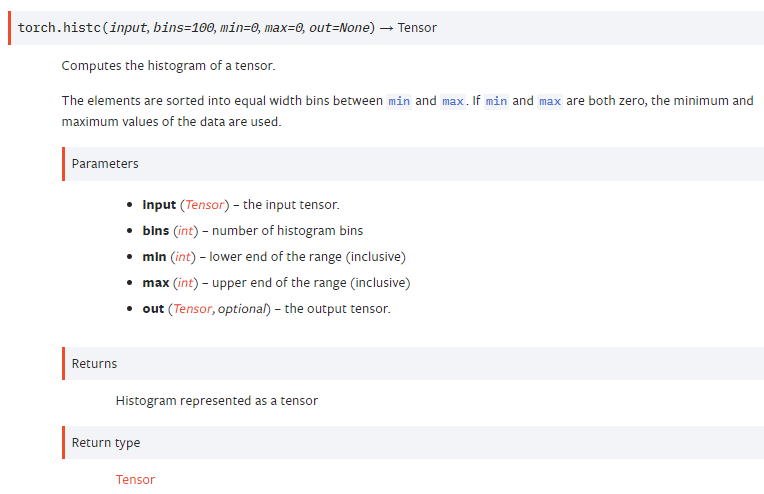
注意:返回的直方图是基于整个输入的Tensor来说的,min和max如果默认都为0,则为Tensor的最小值和最大值。返回的直方图没有归一化,每个bin的值统计的是个数。
4、局限性
numpy.histgoram()和torch.histc()都无法针对某一维度进行直方图计算。
5、可视化直方图:利用matplotlib.pyplot中的hist()函数
1 import numpy as np
2 import matplotlib.pyplot as plt
3
4 test = np.random.randn(1000000)
5 plt.hist(test, bins='auto', density=True)
6 plt.show()
结果:
