现在环境是这样:
ceph 4台:
192.168.100.21 ceph-node1
192.168.100.22 ceph-node2
192.168.100.23 ceph-node3
192.168.100.25 ceph-node5
#已经部署好一个ceph cluster 集群 四个 osd 三个mon 没有使用块存储所有没有mod
监控服务端一台
192.168.100.26 Grafana 上面都是以容器部署了
Prometheus:
Grafana:
alertmanager:
prometheus-webhook-alert:
cAdvisor:
docker-compose 编排如下:
version: "2"
networks:
    monitor:
        driver: bridge
services:
  prometheus:
    image: prom/prometheus
    container_name: prometheu
    hostname: prometheu
    restart: always
    volumes:
    - /Prometheus/config/prometheus.yml:/etc/prometheus/prometheus.yml
    - ./config/alertmanager-rule.yml:/etc/prometheus/alertmanager-rule.yml
    - /etc/localtime:/etc/localtime
    ports:
    - "9090:9090"
    networks:
    - monitor

  prometheus-webhook-alert:
    image: timonwong/prometheus-webhook-dingtalk:v0.3.0
    container_name: prometheus-webhook-alertmanagers
    hostname: webhook-alertmanagers
    restart: always
    volumes:
    - /etc/localtime:/etc/localtime
    ports:
    - "8060:8060"
    entrypoint: /bin/prometheus-webhook-dingtalk --ding.profile="webhook1=https://****#钉钉webhook自己去申请一个"
    networks:
    - monitor

  alertmanager:
    image: prom/alertmanager
    container_name: alertmanager
    hostname: alertmanager
    restart: always
    volumes:
      - ./config/alertmanager.yml:/etc/alertmanager/alertmanager.yml
      - /etc/localtime:/etc/localtime
    ports:
      - "9093:9093"
    networks:
      - monitor

  grafana:
    image: grafana/grafana
    container_name: grafana
    hostname: grafana
    restart: always
    volumes:
    - /etc/localtime:/etc/localtime
    - ./grafana-piechart:/var/lib/grafana/plugins/grafana-piechart-panel
    ports:
    - "3000:3000"
    networks:
    - monitor

  cadvisor:
    image: google/cadvisor:latest
    container_name: cadvisor
    hostname: cadvisor
    restart: always
    volumes:
    - /:/rootfs:ro
    - /var/run:/var/run:rw
    - /sys:/sys:ro
    - /var/lib/docker/:/var/lib/docker:ro
    - /etc/localtime:/etc/localtime
    ports:
    - "8080:8080"
    networks:
    - monitor
几处关键配置文件如下:
#普罗米修斯配置文件
cat ./config/prometheus.yml
# my global config
global:
  scrape_interval:     15s # Set the scrape interval to every 15 seconds. Default is every 1 minute.
  evaluation_interval: 15s # Evaluate rules every 15 seconds. The default is every 1 minute.

# Alertmanager configuration
alerting:
  alertmanagers:
  - static_configs:
    - targets: ["192.168.100.26:9093"]
# Load rules once and periodically evaluate them according to the global 'evaluation_interval'.
rule_files:
  - "alertmanager-rule.yml"

scrape_configs:
  # The job name is added as a label `job=<job_name>` to any timeseries scraped from this config.
  - job_name: 'prometheus'
    static_configs:
    - targets: ['192.168.100.26:9090']

  - job_name: 'cadvisor-1'
    static_configs:
    - targets: ['192.168.100.26:8080']

  - job_name: 'node-1'
    scrape_interval: 4s
    static_configs:
    - targets: ['192.168.100.26:9100']

  - job_name: 'cadvisor-2'
    static_configs:
    - targets: ['192.168.100.25:8080']

  - job_name: 'node-2'
    scrape_interval: 4s
    static_configs:
    - targets: ['192.168.100.25:9100']

  - job_name: 'ceph'
    scrape_interval: 4s
    static_configs:
    - targets: ['192.168.100.21:9128']
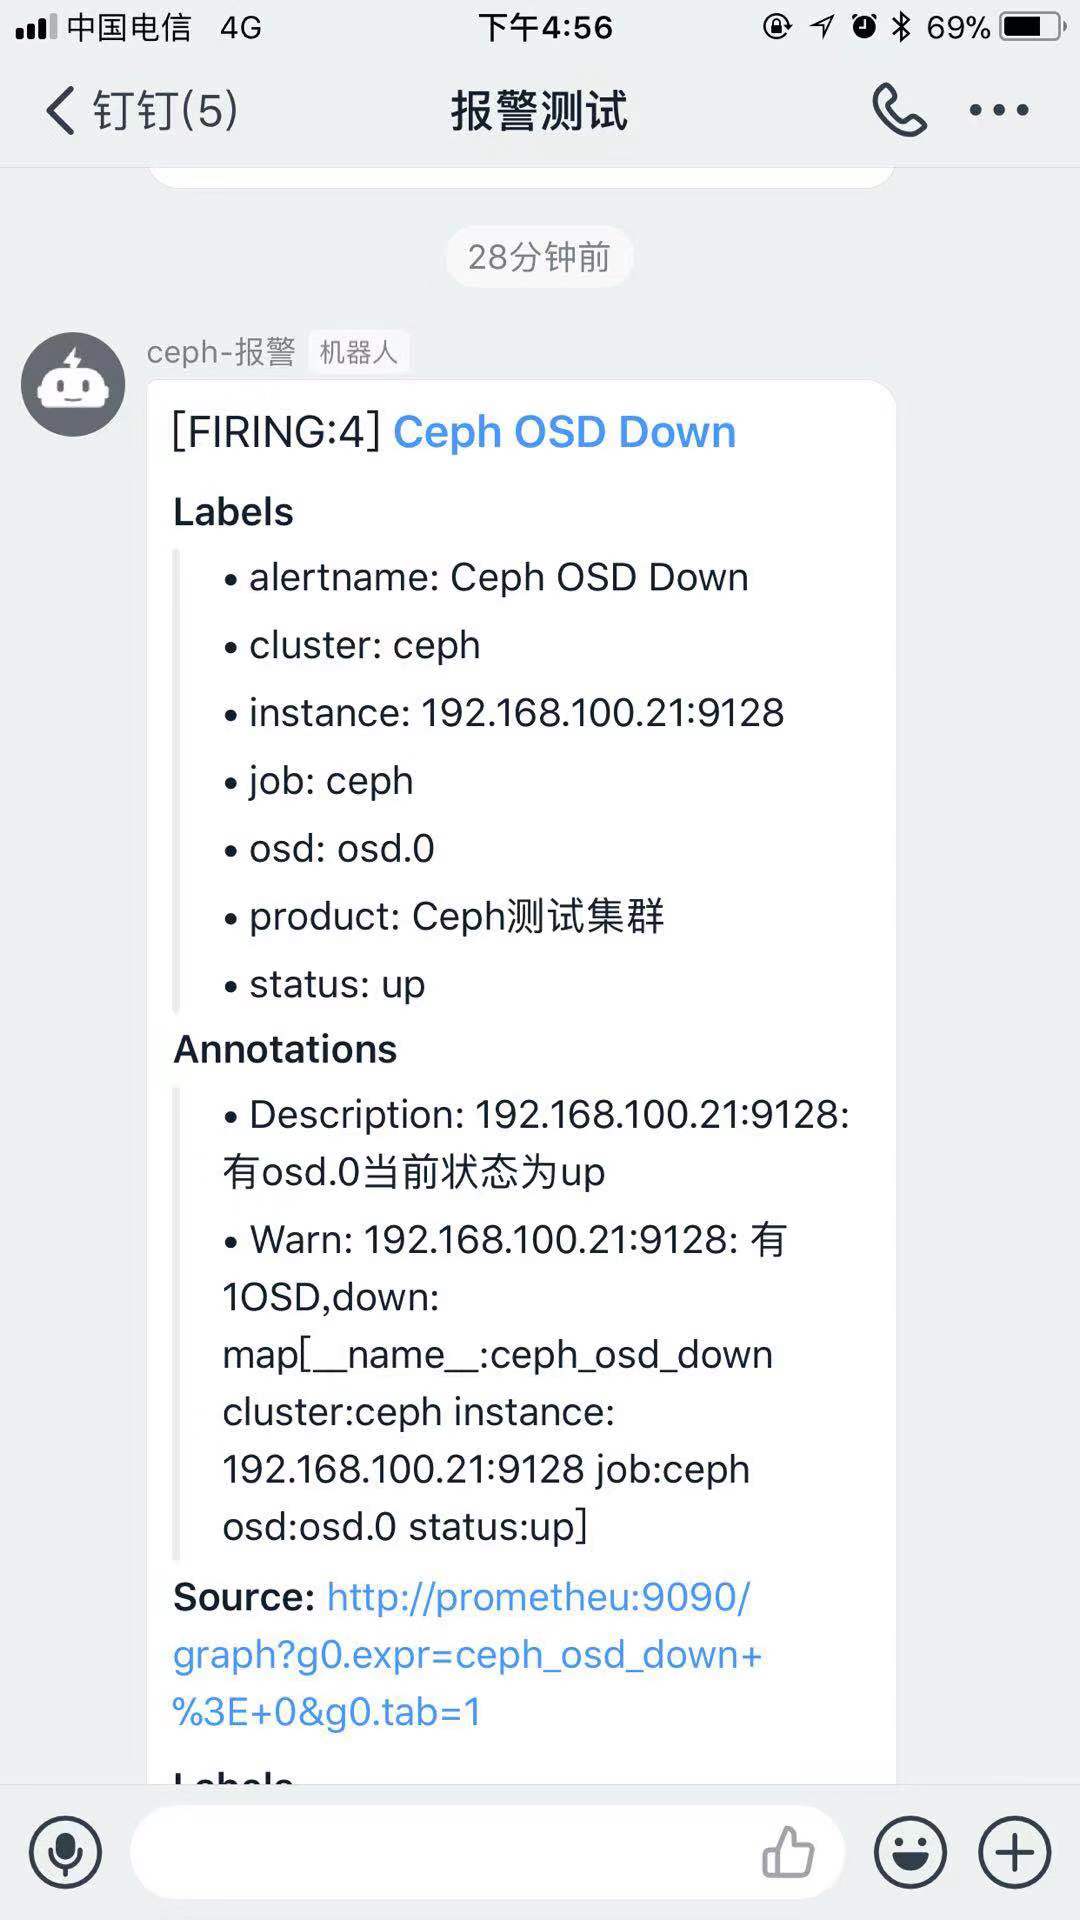
#监控报警组件 压制 合并 过滤配置文件 并配置webhook地址
cat ./config/alertmanager.yml
global:
  resolve_timeout: 5m
route:
  group_by: ['alertname']
  group_wait: 10s
  group_interval: 10s
  repeat_interval: 1h
  receiver: 'web.hook'

receivers:
- name: 'web.hook'
  webhook_configs:
  - url: 'http://192.168.100.26:8060/dingtalk/webhook1/send'
    send_resolved: true

inhibit_rules:
  - source_match:
      severity: 'critical'
    target_match:
      severity: 'warning'
    equal: ['alertname', 'dev', 'instance']
#监控报警规则配置文件
cat ./alertmanager-rule.yml
groups:
- name: ceph-rule
  rules:
  - alert: Ceph OSD Down
    expr: ceph_osd_down > 0
    for: 2m
    labels:
      product: Ceph测试集群
    annotations:
      Warn: "{{$labels.instance}}: 有{{ $value }}OSD,down: {{$labels}}"
      Description: "{{$labels.instance}}:有{{ $labels.osd }}当前状态为{{ $labels.status }}"

  - alert: 集群空间使用率
    expr: ceph_cluster_used_bytes / ceph_cluster_capacity_bytes * 100 > 80
    for: 2m
    labels:
      product: Ceph测试集群
    annotations:
      Warn: "{{$labels.instance}}:集群空间不足"
      Description: "{{$labels.instance}}:当前空间使用率为{{ $value }}"
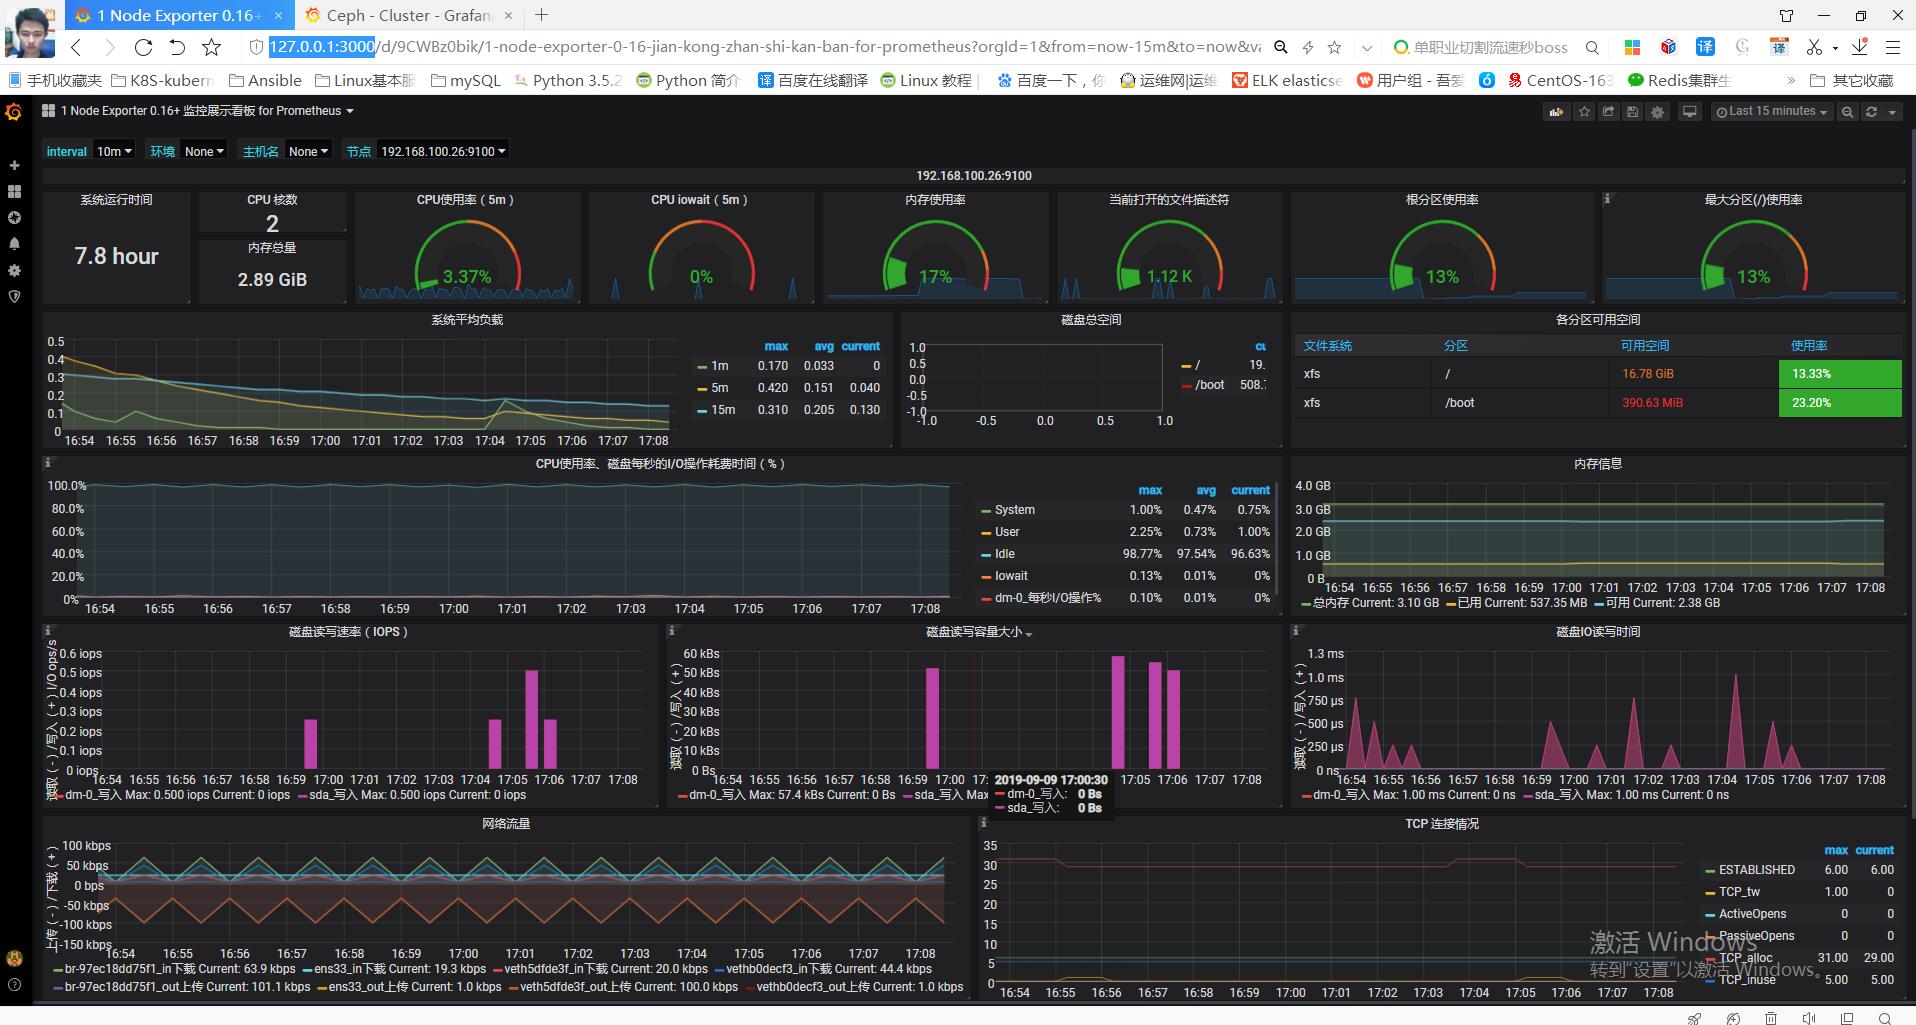
node-exporter: json模板下载 https://grafana.com/grafana/dashboards/10645
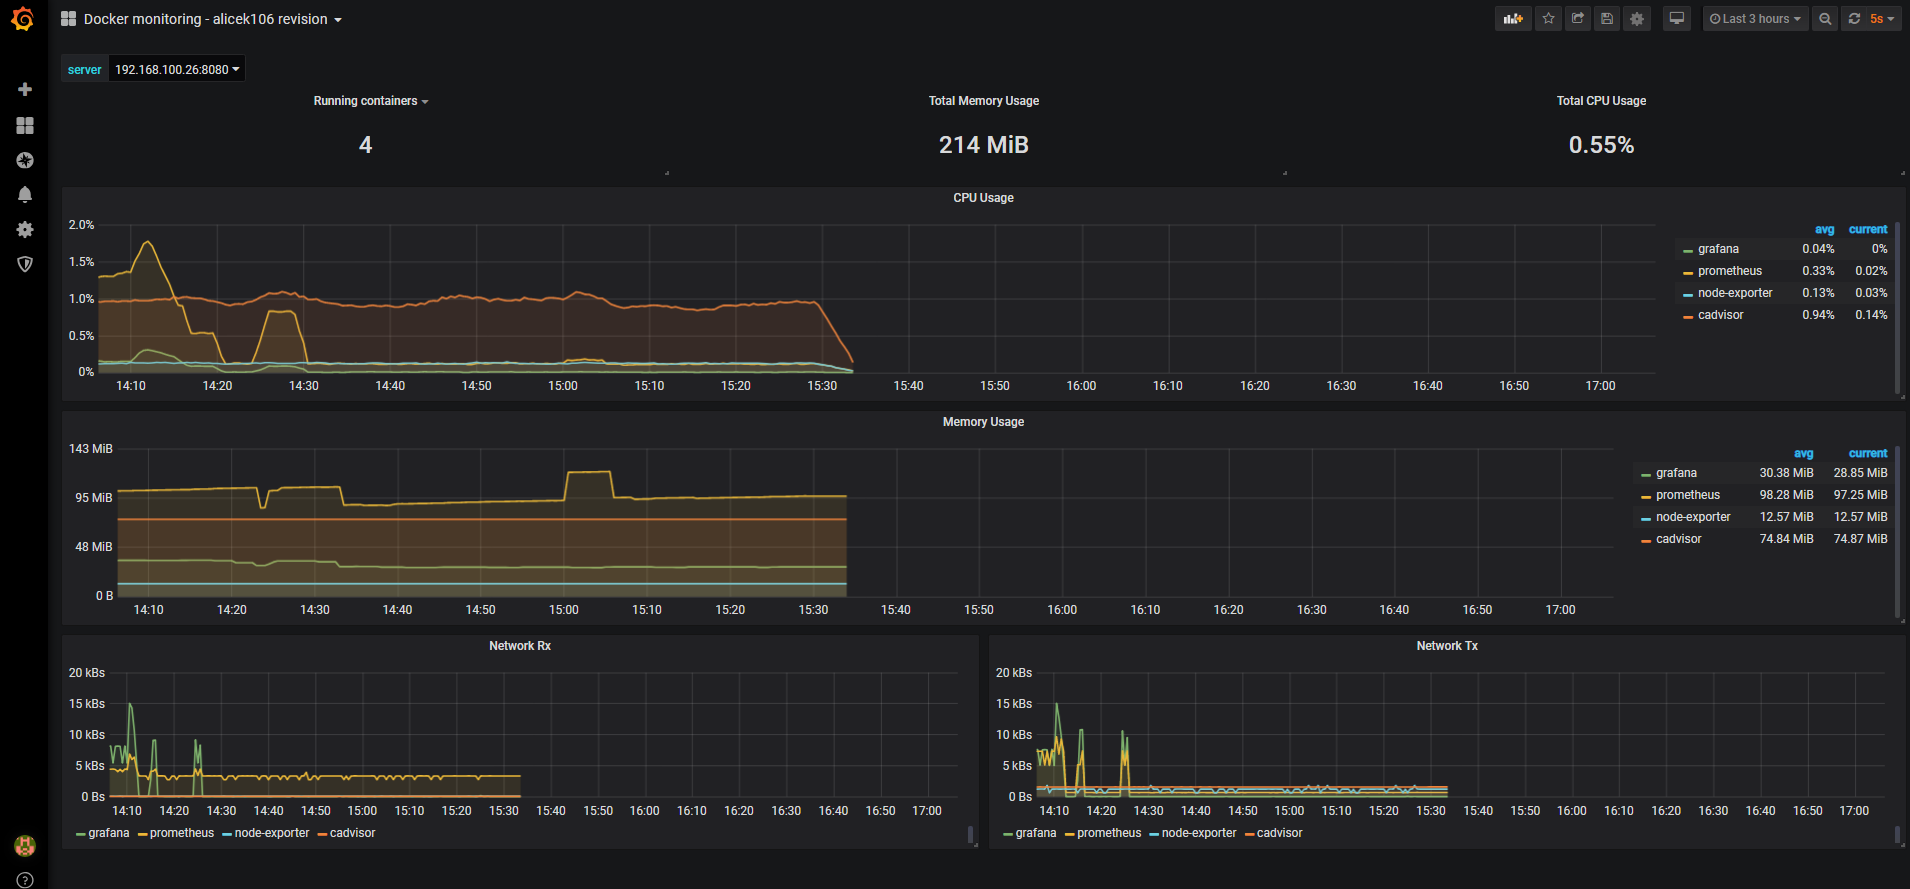
cadvisor: json模板下载: https://grafana.com/grafana/dashboards/3125
ceph cluster: json模板下载: https://grafana.com/grafana/dashboards/917%5D
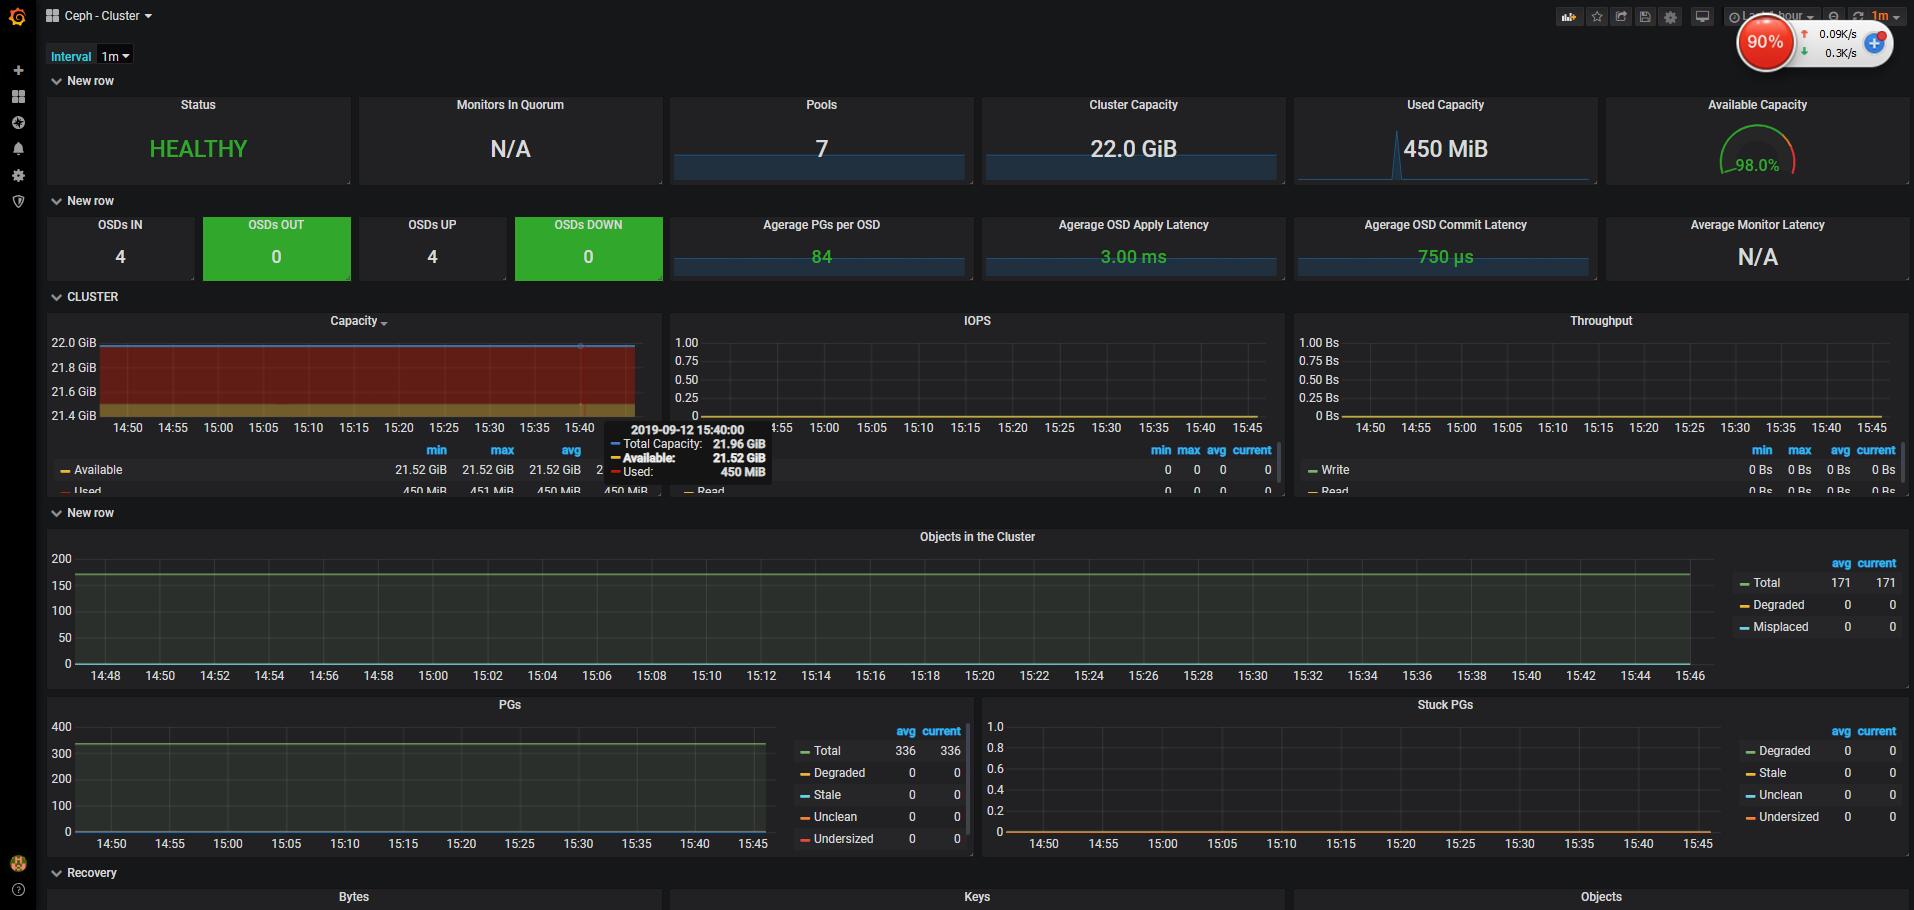
最后来一张完成 成果图