今天去了学院的运动会呢~扮熊本熊超开心~写完这篇我补上我的图么么哒
××××××××××××文末高能预警!!!!!这个包的安装并不是本周的任务!!!!!我真是萌萌哒××××××××××××××
×××××××××××××××××××××××××××我是熊本分割线××××××××××××××××××××××××××××××××××××××××
安装diveRsity:
好吧,回看官网,说的是

那么。。那几个包都要装了啊。。
Rcpp直接装,
ggplot2需要装digest,gtable,MASS,plyr,reshape2(stringr(stringi,magritti)),scales(RColorBrewer,dichromat,munsell(colorspace),labelling)
shiny需要装

qgraph需要装 
psych: foreign和mnormt
lavaan: quadprog和pbivnorm
sem: matrixcalc,boot和mi(matrix(lattice)和arm(nlme,coda,abind和lme4(nloptr和minqa和RcppRigen)))
Hmisc: survival, Formula, latticeExtra, cluster, rpart, nnet, gridExtra, data.table(chron), viridis, htmltools, htmlTable(knitr(evaluate, formatR, highr, markdown, yaml))
igraph: irlba和NMF(pkgmaker(codetools, registry), rngtools, gridBase, foreach(iterators), doParallel, reshape2)
sna: statnet.common和network
huge: igraph(irlba)
d3Network: rjson和whisker
嗯。。finally

××××××××××××××××××××啦啦啦我是分割线×××××××××××××××××××××××××××××××××××××××××××
Shannon diversity: 估算群落多样性的高低
计算公式:R是总物种数,pi是第i个物种占总数的比例

其他多样性指数的介绍可以参考这一篇:
http://wenku.baidu.com/link?url=DWOFlUMQvinjaye4SJhi37pVO9fG6NTQTQdUvBjcR_V0cBhZg3EL63D-AIHozokH01AVDZYdXKNbI04nCY6aSj8DJPOoJ-VRDj4Yr0C2ppW
××××××××××××××××××××啊啊啊啊啊我要疯掉了××××××××××××××××××××××××××××××××××××××××××
这个包根本不用装!!!!shannon diversity的计算是vegan的一个函数!!!!!!
(0) 设置工作路径
setwd("/home/pxy7896/Desktop")
(1) 读取文件
mydata = read.table("testSh.txt") # 此处是有问题的!!!!!
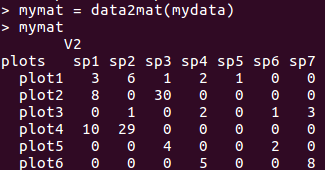
(2) 将table数据转化为矩阵
安装spaa包,导入
library(spaa)

所以啊。。。回去乖乖加表头=。=
加在testSh.txt中并没有什么用,仍然报错。。。help(read.table),告诉我,要设置header为TRUE
这样表头就被解析出来了。
testSh.txt里面的内容现在是这个样子的:


这样,执行data2mat函数,就可以得到矩阵了。
(3) 计算

(4) diversity函数里其他的东西呢?(Shannon, Simpson, and Fisher diversity indices and species richness.)
4.1 diversity(x, index = "shannon", MARGIN = 1, base = exp(1))
x是数据,矩阵或向量
index是shannon simpson invsimpson
margin是??Margin for which the index is computed.
base是shannon里用到的log底
4.2 specnumber(x, groups, MARGIN = 1)
groups: A grouping factor: if given, finds the total number of species in each group.
计算每个plot里的物种数(不是abundance,是指有几个物种)
s = specnumber(mymat)
4.3 fisher.alpha(x, MARGIN = 1, ...)