硬件环境:
两台虚拟机,
10.10.20.203 部署docker、etcd、flannel、kube-apiserver、kube-controller-manager、kube-scheduler、influxdb、grafana
10.10.20.206 部署docker、flannel、kubelet、kube-proxy、cadvisor
10.10.20.207 部署docker、flannel、kubelet、kube-proxy、cadvisor
【安装influxdb】
1、添加yum源,执行如下指令:
cat <<EOF | sudo tee /etc/yum.repos.d/influxdb.repo,添加以下内容
[influxdb]
name = InfluxDB Repository - RHEL $releasever
baseurl = https://repos.influxdata.com/rhel/$releasever/$basearch/stable
enabled = 1
gpgcheck = 1
gpgkey = https://repos.influxdata.com/influxdb.key
EOF
2、安装influxdb
yum install influxdb
3、重启服务
systemctl enable influxdb
systemctl start influxdb
systemctl status influxdb
4、编辑配置文件(查看配置文件路径,可以执行rpm -qc influxdb)
vi /etc/influxdb/influxdb.conf
将hostname修改为本机IP
hostname = "10.10.20.203"
5、创建库和用户,执行以下指令
influx

CREATE DATABASE testdb

SHOW DATABASES

use testdb

Using database testdb

CREATE USER "root" WITH PASSWORD 'root' WITH ALL PRIVILEGES

show users
【grafana】
1、下载grafana,需要翻墙,地址为https://grafanarel.s3.amazonaws.com/builds/grafana-2.6.0-1.x86_64.rpm
2、安装grafana,rpm -ivh grafana-2.6.0-1.x86_64.rpm
3、重启服务
systemctl enable grafana-server
systemctl start grafana-server
systemctl status grafana-server
4、访问http://10.10.20.203:3000,用户名密码:admin/admin
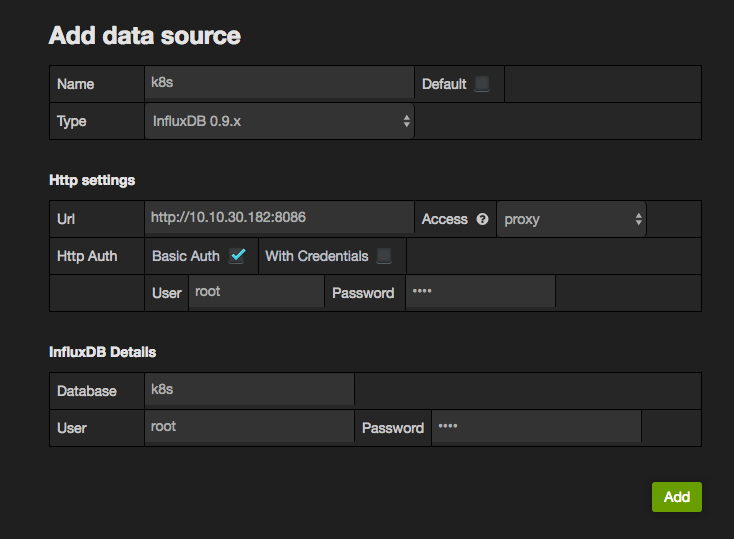
5、添加数据源,连接testdb
【cadvisor】
在需要监控的服务器上安装cadvisor,执行以下指令
docker run -d
--volume=/:/rootfs:ro
--volume=/var/run:/var/run:rw
--volume=/sys:/sys:ro
--volume=/var/lib/docker/:/var/lib/docker:ro
--publish=8080:8080
--detach=true
--name=k8s-slave1-206-monitor
10.10.20.201/library/cadvisor:v1
-storage_driver=influxdb
-storage_driver_db=k8s
-storage_driver_host=10.10.20.203:8086
所有软件都已经安装完毕,可以在grafana上制定dashborad了。