Windows 内存分析之路
How to use Resource Monitor
人之所以区别于动物就在于使用工具,同样,在某种程度上说,在正确的时候使用正确的工具,确实可以提高程序员的生产率。最近在网上看到一篇Resource Monitor的使用的文章,觉得对大家可能会有用处,于是把重点的部分翻译出来,和大家分享,不足的地方欢迎指正。
Resource Monitor - Memory tab (Click the image to enlarge.)
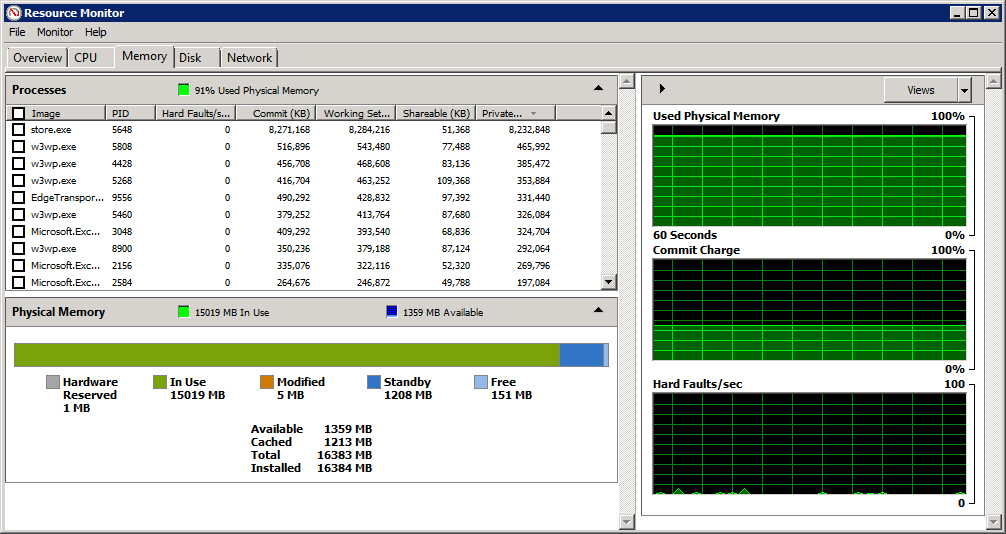
Let’s see what metrics are available with regard to memory on this Windows server.
Processes section
The Memory tab’s Processes section displays key metrics related to how the system’s processes use memory. Here’s information about the metrics:
•Image. Process executable file name. This is the name of the process that is actively using the disk.
进程可执行文件名,正使用内存的进程名。
•PID. Process ID. This is the ID number associated with the process; it is useful if you want to use other utilities to manage processes, or if you want to easily match up processes with Task Manager.
进程ID。和这个进程关联的进程ID;这个非常有用,如果你想要使用其他工具管理进程,或者需要方便的和task manager 一起使用。
•Hard Faults/sec. A hard fault doesn’t necessarily indicate a critical error condition, though it may indicate that the server is in need of more RAM. A hard fault occurs every time the system uses the swap file on the disk. This is important because disk storage is much, much slower than RAM, so each time the system uses disk-based virtual RAM, there is a significant performance penalty. If you see hard faults on a regular basis (especially if the numbers are large), you should consider adding more RAM to the server. Hard faults are sometimes referred to as Page Faults.
Hard Faults/sec. hard fault并不一定是严重的错误,但是他可能说明服务器需要内存。每次系统使用硬盘交换文件的时候产生hard fault,这很重要,因为硬盘比内存慢很多,所以当系统使用基于硬盘的虚拟内存的时候,就会有明显的性能损失。如果你总看到规律的hard fault 你应该考虑给服务器加内存了,hard fault 有时被称为Page Faults。
•Commit (KB). This is the total amount of physical and virtual memory (page file) that is committed to this specific process.
每个进程提交的虚拟内存总量。
•Working Set (KB). This is the amount of physical memory that is committed to this particular process. This number should be the total of the next two metrics, which are its components.
每个进程提交的物理内存总量。= Shareable+ Private。
•Shareable (KB). This is the total amount of physical memory that is committed to this particular process but that can also be shared with another process.
每个进程提交的物理内存总量,可以和其他进程共享的部分。
•Private (KB). This is the total amount of physical memory that is committed to this particular process but cannot be shared with another process.
每个进程提交的物理内存总量,不可以和其他进程共享的部分。
Physical Memory
Below the Processes section, you’ll see a section called Physical Memory that contains this information:
•In Use. The amount of memory that is in use right now.
正使用的内存总量。
•Available. Of the total physical memory in the system, this is how much is still available for allocation.
剩余的物理内存总量。
•Hardware Reserved. This identifies the amount of memory that various hardware devices have set aside for their dedicated use. Almost any device in the server can add to this metric. This Exchange Server clocks in at 1MB.
硬件保留的物理内存。
•Modified. As information is written into memory pages, it stays there while other processing goes on behind the scenes. As information is updated on these memory pages, those pages are marked as having been modified. After a period of time, in order to ensure that the system makes the best use of available memory resources, modified pages that have not been accessed in a while might be moved to the standby category.
由于信息被写入内存页,当其他处理进行的时候他就在那。由于那些内存页的信息被更新了,那些页面被标记为已更新。过一段时间,为了使系统最好的使用可用内存资源,如果被更新的页面在一段时间不被访问,可能被移动到standby目录中。
•Standby. This memory contains cached data and code that is not actively in use but that may be called into action at some point. Windows manages this class of RAM by prioritizing each page that comes in. As other processes need RAM, low priority pages from this pool are reallocated to other needs.
这些内存包含缓存数据和代码,虽然现在没有被使用,但是在将来的某个时刻可能会被使用。Windows管理这些内存,在他们进入的时候就标记上优先级。当其它进程需要内存的时候,这个池中的低优先级的页被分配做他用。
•Free. This value is how much RAM is currently available above and beyond what is in use. You might think that having such a small amount of RAM marked as free in this 16 GB system might identify a major problem, but that’s the case. With many of Microsoft’s newer products, it’s better to use as much RAM as possible than to leave it idle. Products such as Exchange use RAM to its fullest extent and cache portions of the product for faster access.
空闲内存。
One common mistake it to use the “In Use” and “Available” metrics as the sole indicators for overall system health and to get concerned when particular processes appear to be eating too much RAM. This is why you need to understand how the application is supposed to behave.
For example, Exchange 2010 often uses as much memory as you can throw at it; this is by design. The thinking is that Exchange will use RAM to cache as much information as possible in order to improve overall performance. So it’s important to look at other metrics, such as Hard Faults, to determine if there is a really a RAM-related performance issue on an Exchange 2010 machine. If a service shouldn’t be using a lot of RAM and it is, you need to do more troubleshooting; this is the point at which you might fire up Performance Monitor to gather more specific details.
Conclusion
Throughout this four-part series on Resource Monitor, I hope you learned new ways to monitor your Windows Server systems using a free, easy to use tool that Microsoft built to help administrators solve performance-related issues.
原文地址:
http://www.techrepublic.com/blog/datacenter/use-resource-monitor-for-memory-monitoring/4927