1、下载 GitHub 上的 ecomfe/echarts-for-weixin 项目,Echarts微信版。
地址:https://github.com/ecomfe/echarts-for-weixin
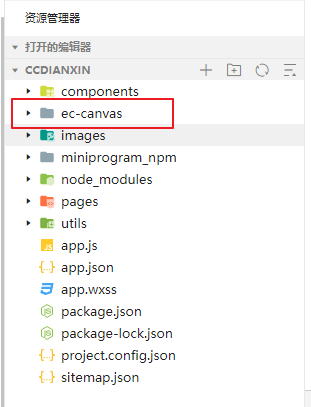
2、将 ec-canvas 文件放置到小程序项目中

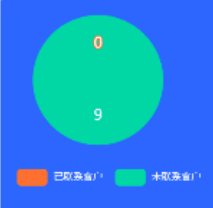
3、使用echarts(饼图为例)
// json文件

"usingComponents": {
   "ec-canvas": "../../ec-canvas/ec-canvas"
 }
// wxml文件

<view class="containers">
  <ec-canvas id="mychart-dom-bar" canvas-id="mychart-bar" ec="{{ ec }}"></ec-canvas>
</view>

// 外层用view包裹方便设置echarts元素的宽高
// js

import * as echarts from '../../ec-canvas/echarts';

const app = getApp()
function initChart(canvas, width, height, dpr) {
  const chart = echarts.init(canvas, null, {
     width,
    height: height,
    devicePixelRatio: dpr // 像素
  });
  canvas.setChart(chart);

  let option = {
    title: {},
    tooltip: {
      trigger: 'item',
      formatter: '{b} : {c}'
    },
    legend: {
      left: 'center',
      bottom: 20,
      textStyle: {
        fontSize: 8,
        color: '#ffffff'
      },
      data: ['已联系客户', '未联系客户']
    },
    color: ['#FD7031','#00d6a5'],
    series: [{
      name: '客户',
      type: 'pie',
      radius: '60%',
      center: ["45%", "38%"],
      label: {
        position: 'inner',
        show: true,
        formatter: '{c}'
      },
      data: [{
          value: app.globalData.pieData? app.globalData.pieData[0] : 0,
          name: '已联系客户',
          formatter: '{c}',
          tooltip: {
            trigger: 'item',
            formatter: '{b} : {c}'
          }
        },
        {
          value: app.globalData.pieData? app.globalData.pieData[1] : 0,
          name: '未联系客户',
          formatter: '{c}',
          tooltip: {
            trigger: 'item',
            formatter: '{b} : {c}'
          }
        }
      ],
      emphasis: {
        itemStyle: {
          shadowBlur: 10,
          shadowOffsetX: 0,
          shadowColor: 'rgba(0, 0, 0, 0.5)'
        }
      },
    }]
  };
  chart.setOption(option);
  return chart;
}

Page({
  data: {
    ec: {
      onInit: initChart
    }
  }
})
4、效果图