|
Day |
Outlook |
Temperature |
Humidity |
Wind |
PlayTennis |
|
1 |
Sunny |
Hot |
High |
Weak |
No |
|
2 |
Sunny |
Hot |
High |
Strong |
No |
|
3 |
Overcast |
Hot |
High |
Weak |
Yes |
|
4 |
Rain |
Mild |
High |
Weak |
Yes |
|
5 |
Rain |
Cool |
Normal |
Weak |
Yes |
|
6 |
Rain |
Cool |
Normal |
Strong |
No |
|
7 |
Overcast |
Cool |
Normal |
Strong |
Yes |
|
8 |
Sunny |
Mild |
High |
Weak |
No |
|
9 |
Sunny |
Cool |
Normal |
Weak |
Yes |
|
10 |
Rain |
Mild |
Normal |
Weak |
Yes |
|
11 |
Sunny |
Mild |
Normal |
Strong |
Yes |
|
12 |
Overcast |
Mild |
High |
Strong |
Yes |
|
13 |
Overcast |
Hot |
Normal |
Weak |
Yes |
|
14 |
Rain |
Mild |
High |
Strong |
No |
对于上面例子,如何判断是否要去playtennis?
可以采用决策树的方式。
决策树是一种以实例为基础的归纳学习算法。从无序列/无规则的数据中,推导出树形表示的分类判决。
优点:计算量小、显示清晰
缺点:容易过拟合(需要修枝)(譬如,使用day做判决,一一对应虽然很准确,但是不能用在其他地方)、对时间顺序的数据,需要过多预处理工作
ID3算法:
1、对于实例,计算各个属性的信息增益
2、对于信息增益最大的属性P作为根节点,P的各个取值的样本作为子集进行分类
3、对于子集下,若只含有正例或反例,直接得到判决;否则递归调用算法,再次寻找子节点

熵:表示随机变量的不确定性。
条件熵:在一个条件下,随机变量的不确定性。
信息增益:熵 - 条件熵,在一个条件下,信息不确定性减少的程度。
用信息增益最大的属性作为结点,是因为最终去不去打球的不确定性,在获得该属性的结果后,不确定性大大降低。
也就是说,该属性对于打球的选择很重要。
对于解决上述问题,
首先,计算系统熵,PlayTennis
P(No) = 5/14
P(Yes) = 9/14
Entropy(S) = -(9/14)*log(9/14)-(5/14)*log(5/14) = 0.94
然后,计算各个属性的熵。
譬如:Wind
其中,Wind中取值为weak的记录有8条,其中,playtennis的正例6个,负例2个;取值为strong的记录有6条,正例为3个,负例为3个。
Entrogy(weak) = -(6/8)*log(6/8)-(2/8)*log(2/8) = 0.811
Entrogy(strong) = -(3/6)*log(3/6)-(3/6)*log(3/6) = 1.0
对应的信息增益为:
Gain(Wind) = Entropy(S) – (8/14)* Entrogy(weak)-(6/14)* Entrogy(strong) = 0.048
同理,Gain(Humidity = 0.151;Gain(Outlook = 0.247;Gain(Temperature = 0.029
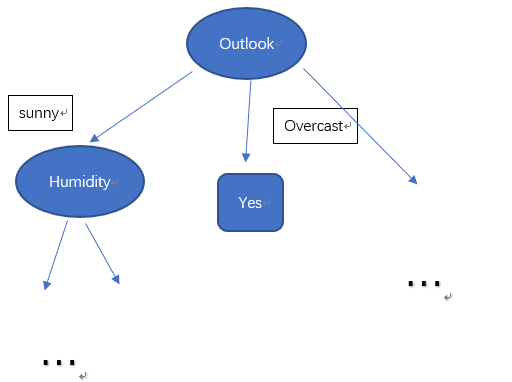
此时,可以得到跟节点为:Outlook
对应点决策树:
Outlook分为三个集合:
Sunny:{1,2,8,9,11},正例:2、反例:3
Overcast:{3,7,12,13},正例:4、反例:0
Rain:{4,5,6,10,14},正例:3、反例:2
至此,可以得到:
Sunny:
|
Day |
Outlook |
Temperature |
Humidity |
Wind |
PlayTennis |
|
1 |
Sunny |
Hot |
High |
Weak |
No |
|
2 |
Sunny |
Hot |
High |
Strong |
No |
|
8 |
Sunny |
Mild |
High |
Weak |
No |
|
9 |
Sunny |
Cool |
Normal |
Weak |
Yes |
|
11 |
Sunny |
Mild |
Normal |
Strong |
Yes |
Entropy(S) = -(3/5)*log(3/5)-(2/5)*log(2/5) = 0.971
对于Wind,weak时,正例为1,反例为2;Strong时,正例为1,反例为1.
Entrogy(weak) = -(1/3)*log(1/3)-(2/3)*log(2/3) = 0.918
Entrogy(strong) = -(1/2)*log(1/2)-(1/2)*log(1/2) = 1
Gain(Wind) = Entropy(S) – 3/5* Entrogy(weak)-2/5* Entrogy(strong) = 0.0202
同理,Gain(Humidity) = 0.971;Gain(Temperature) = 0.571
此时,可以画出部分决策树:
其中,python代码:
import math
#香农公式计算信息熵
def calcShannonEnt(dataset):
    numEntries = len(dataset)
    labelCounts = {}
    for featVec in dataset:
        currentLabel = featVec[-1]#最后一位表示分类
        if currentLabel not in labelCounts.keys():
            labelCounts[currentLabel] = 0
        labelCounts[currentLabel] +=1

    shannonEnt = 0.0
    for key in labelCounts:
        prob = float(labelCounts[key])/numEntries
        shannonEnt -= prob*math.log(prob, 2)
    return shannonEnt

def CreateDataSet():
    dataset = [['sunny', 'hot','high','weak', 'no' ],
               ['sunny', 'hot','high','strong', 'no' ],
               ['overcast', 'hot','high','weak', 'yes' ],
               ['rain', 'mild','high','weak', 'yes' ],
               ['rain', 'cool','normal','weak', 'yes' ],
                ['rain', 'cool','normal','strong', 'no' ],
                ['overcast', 'cool','normal','strong', 'yes' ],
                ['sunny', 'mild','high','weak', 'no' ],
                ['sunny', 'cool','normal','weak', 'yes' ],
                ['rain', 'mild','normal','weak', 'yes' ],
                ['sunny', 'mild','normal','strong', 'yes' ],
                ['overcast', 'mild','high','strong', 'yes' ],
                ['overcast', 'hot','normal','weak', 'yes' ],
                ['rain', 'mild','high','strong', 'no' ],
               ]
    labels = ['outlook', 'temperature', 'humidity', 'wind']
    return dataset, labels
#选取属性axis的值value的样本表
def splitDataSet(dataSet, axis, value):
    retDataSet = []
    for featVec in dataSet:
        if featVec[axis] == value:
            reducedFeatVec = featVec[:axis]
            reducedFeatVec.extend(featVec[axis+1:])
            retDataSet.append(reducedFeatVec)

    return retDataSet
#选取信息增益最大的属性作为节点
def chooseBestFeatureToSplit(dataSet):
    numberFeatures = len(dataSet[0])-1
    baseEntropy = calcShannonEnt(dataSet)
    bestInfoGain = 0.0
    bestFeature = -1
    for i in range(numberFeatures):
        featList = [example[i] for example in dataSet]
        uniqueVals = set(featList)
        newEntropy =0.0
        for value in uniqueVals:
            subDataSet = splitDataSet(dataSet, i, value)
            prob = len(subDataSet)/float(len(dataSet))
            newEntropy += prob * calcShannonEnt(subDataSet)
        infoGain = baseEntropy - newEntropy
        if(infoGain > bestInfoGain):
            bestInfoGain = infoGain
            bestFeature = i
    return bestFeature
#对于属性已经用完,仍然没有分类的情况,采用投票表决的方法
def majorityCnt(classList):
    classCount ={}
    for vote in classList:
        if vote not in classCount.keys():
            classCount[vote]=0
        classCount[vote] += 1
    return max(classCount)


def createTree(dataSet, labels):
    classList = [example[-1] for example in dataSet]
    #类别相同停止划分
    if classList.count(classList[0])==len(classList):
        return classList[0]
    #属性用完,投票表决
    if len(dataSet[0])==1:
        return majorityCnt(classList)
    bestFeat = chooseBestFeatureToSplit(dataSet)
    bestFeatLabel = labels[bestFeat]
    myTree = {bestFeatLabel:{}}
    del(labels[bestFeat])
    featValues = [example[bestFeat] for example in dataSet]
    uniqueVals = set(featValues)
    for value in uniqueVals:
        subLabels = labels[:]
        myTree[bestFeatLabel][value] = createTree(splitDataSet(dataSet, bestFeat, value), subLabels)
    return myTree


myDat,labels = CreateDataSet()
tree = createTree(myDat,labels)
print tree
在计算决策树的时候,sklearn库提供了决策树的计算方法(tree),但是,这个库提供的是:
scikit-learn uses an optimised version of the CART algorithm.
对于本文中使用的ID3算法是不支持的。
然而https://pypi.python.org/pypi/decision-tree-id3/0.1.2
该库支持ID3算法。
按照官网说明,注意安装时的依赖库的版本,该升级的升级,该安装的安装即可。‘
from id3 import Id3Estimator
from id3 import export_graphviz

X = [['sunny',    'hot',   'high',   'weak'],
     ['sunny',    'hot',   'high',   'strong'],
     ['overcast', 'hot',   'high',   'weak'],
     ['rain',     'mild',  'high',   'weak'],
     ['rain',     'cool',  'normal', 'weak'],
     ['rain',     'cool',  'normal', 'strong'],
     ['overcast', 'cool',  'normal', 'strong'],
     ['sunny',    'mild',  'high',   'weak'],
     ['sunny',    'cool',  'normal', 'weak'],
     ['rain',     'mild',  'normal', 'weak'],
     ['sunny',    'mild',  'normal', 'strong'],
     ['overcast', 'mild',  'high',   'strong'],
     ['overcast', 'hot',   'normal', 'weak'],
     ['rain',     'mild',  'high',   'strong'],
]
Y = ['no','no','yes','yes','yes','no','yes','no','yes','yes','yes','yes','yes','no']
f = ['outlook','temperature','humidity','wind']
estimator = Id3Estimator()
estimator.fit(X, Y,check_input=True)
export_graphviz(estimator.tree_, 'tree.dot', f)
然后通过GraphViz工具生成PDF
dot -Tpdf tree.dot -o tree.pdf
结果:

当然,你也可以进行预测判断:
print estimator.predict([['rain', 'mild', 'high', 'strong']])