拟合练习:

1 function f = curvefun(x, tdata)
2 f = (x(1)*x(2)*x(3)) / (x(3)-x(2)) * ( exp(-x(2)*tdata)/(x(4)-x(2)) + exp(-x(3)*tdata)/(x(4)-x(3)) - (1/(x(4)-x(2))+1/(x(4)-x(3)))*exp(-x(4)*tdata) );
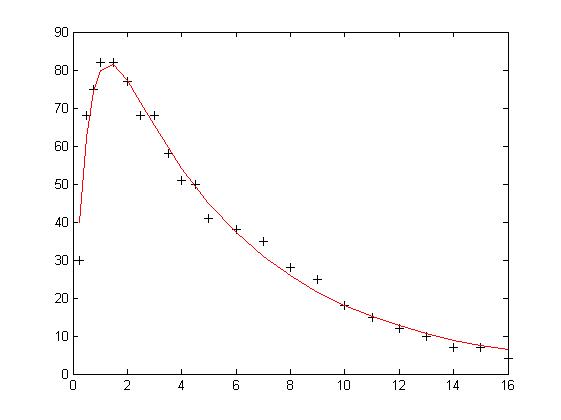
 1 %数据输入
 2 tdata = [0.25 0.5 0.75 1 1.5 2 2.5 3 3.5 4 4.5 5 6 7 8 9 10 11 12 13 14 15 16];
 3 vdata = [30 68 75 82 82 77 68 68 58 51 50 41 38 35 28 25 18 15 12 10 7 7 4];
 4 %拟定估计值
 5 x0 = [1 2 3 4];
 6 x = lsqcurvefit('curvefun', x0, tdata, vdata)
 7 f = curvefun(x, tdata)
 8 %作散点图和你和图
 9 plot(tdata, vdata, 'k+')
10 hold on
11 plot(tdata, f, 'r')
结果: x =
256.2035 0.1512 0.2422 1.9506
f =
Columns 1 through 8
39.7501 62.2565 74.2700 79.9309 81.3616 77.1765 71.3312 65.2712
Columns 9 through 16
59.5001 54.1706 49.3072 44.8893 37.2494 30.9669 25.7925 21.5224
Columns 17 through 23
17.9914 15.0658 12.6370 10.6167 8.9330 7.5272 6.3515
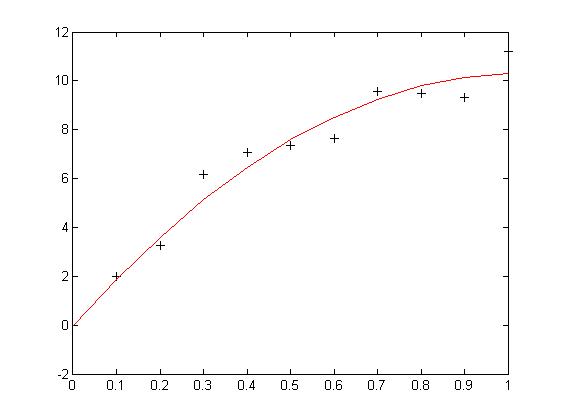
方法一:解超定方程组
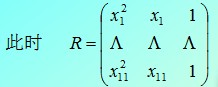
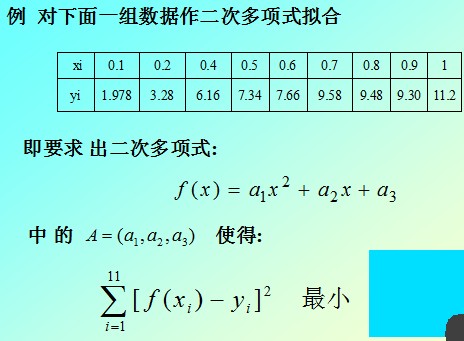
1 x = 0:0.1:1;
2 y = [-0.447 1.978 3.28 6.16 7.08 7.34 7.66 9.56 9.48 9.30 11.2];
3 R = [(x.^2)', x', ones(11, 1)];
4 A = Ry'
结果:
A =
-9.8108 20.1293 -0.0317
即为系数a1, a2, a3
方法二:用多项式拟合
 1 x = 0:0.1:1;
 2 y = [-0.447 1.978 3.28 6.16 7.08 7.34 7.66 9.56 9.48 9.30 11.2];
 3 %二次多项式拟合
 4 A = polyfit(x, y, 2)
 5 %计算拟合之后的原始数据点的函数值
 6 Y = polyval(A, x);
 7 %作出数据点和拟合曲线的图形
 8 plot(x, y, 'k+')
 9 hold on
10 plot(x, Y, 'r')
结果:
A =
-9.8108 20.1293 -0.0317
拟合曲线