保存和加载模型
在PyTorch中使用torch.save来保存模型的结构和参数,有两种保存方式:
# 方式一:保存模型的结构信息和参数信息
torch.save(model, './model.pth')

# 方式二:仅保存模型的参数信息
torch.save(model.state_dict(), './model_state.pth')
相应的,有两种加载模型的方式:
# 方式一:加载完整的模型结构和参数信息,在网络较大时加载时间比较长,同时存储空间也比较大
model1= torch.load('model.pth')

# 方式二:需先搭建网络模型model2,然后通过下面的语句加载参数
model2.load_state_dic(torch.load('model_state.pth'))
注:用以上的方法保存模型时,可能会遇到UserWarning: Couldn't retrieve source code for container of type Net. It won't be checked for correctness upon loading."type " + obj.__name__ + ". It won't be checked ",可参考这篇知乎文章解决这类警告。
示例
例子来自莫烦Python
import torch
import matplotlib.pyplot as plt

# fake data
x = torch.unsqueeze(torch.linspace(-1, 1, 100), dim=1)  # x data (tensor), shape=(100, 1)
y = x.pow(2) + 0.2*torch.rand(x.size())  # noisy y data (tensor), shape=(100, 1)


def save():
    # save net1
    net1 = torch.nn.Sequential(
        torch.nn.Linear(1, 10),
        torch.nn.ReLU(),
        torch.nn.Linear(10, 1)
    )
    optimizer = torch.optim.SGD(net1.parameters(), lr=0.3)
    loss_func = torch.nn.MSELoss()

    for t in range(100):
        prediction = net1(x)
        loss = loss_func(prediction, y)
        optimizer.zero_grad()
        loss.backward()
        optimizer.step()

    # plot result
    plt.figure(1, figsize=(10, 3))
    plt.subplot(131)
    plt.title('Net1')
    plt.scatter(x.data.numpy(), y.data.numpy())
    plt.plot(x.data.numpy(), prediction.data.numpy(), 'r-', lw=5)

    # 2 ways to save the net
    torch.save(net1, 'net.pkl')  # save entire net
    torch.save(net1.state_dict(), 'net_params.pkl')   # save only the parameters


def restore_net():
    # restore entire net1 to net2
    net2 = torch.load('net.pkl')
    prediction = net2(x)

    # plot result
    plt.subplot(132)
    plt.title('Net2')
    plt.scatter(x.data.numpy(), y.data.numpy())
    plt.plot(x.data.numpy(), prediction.data.numpy(), 'r-', lw=5)


def restore_params():
    # restore only the parameters in net1 to net3
    net3 = torch.nn.Sequential(
        torch.nn.Linear(1, 10),
        torch.nn.ReLU(),
        torch.nn.Linear(10, 1)
    )

    # copy net1's parameters into net3
    net3.load_state_dict(torch.load('net_params.pkl'))
    prediction = net3(x)

    # plot result
    plt.subplot(133)
    plt.title('Net3')
    plt.scatter(x.data.numpy(), y.data.numpy())
    plt.plot(x.data.numpy(), prediction.data.numpy(), 'r-', lw=5)
    plt.show()

# save net1
save()

# restore entire net (may slow)
restore_net()

# restore only the net parameters
restore_params()
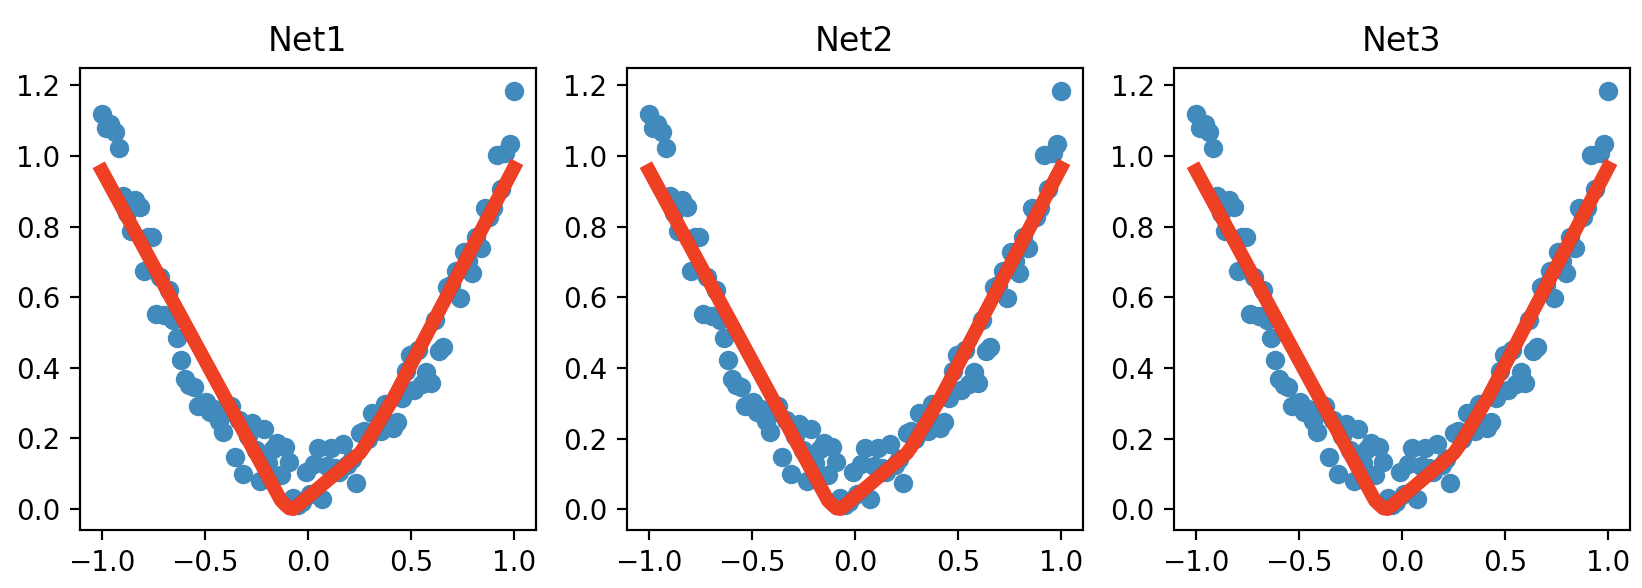
运行结果: