直方图匹配本质上是让两幅图像的累积直方图尽量相似,累积直方图相似了,直方图也就相似了。
把原图像img的直方图匹配到参考图像ref的直方图,包括以下几个步骤:
1. 求出原图像img的累积直方图img_accu;
2. 求出参考图像ref的累积直方图ref_accu;
3. 灰度级g在img_accu中对应的值记为img_accu_g,找出ref_accu中与ref_accu_g最接近的值,记为ref_accu_G,记该值对应的灰度级为G;
4. 根据g和G的对应关系,得到img经过匹配之后的直方图。
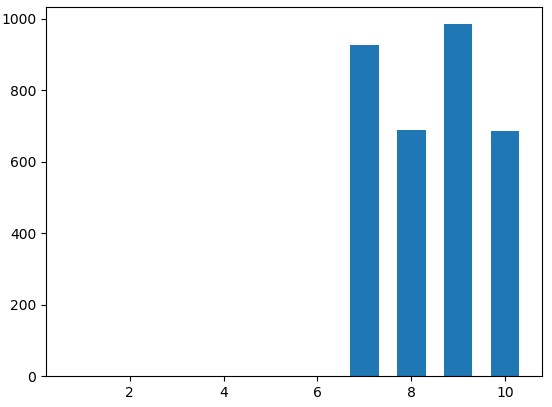
为了说明该过程,我们举一个简单的例子,并把计算过程列在表格中。该例子中图像只有10个灰度级,总共3289个像素,如下图所示。
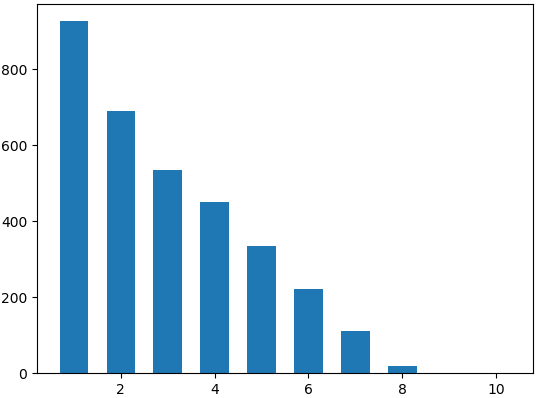
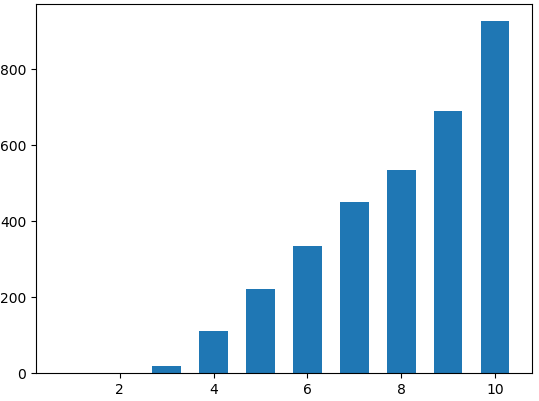
(a) 原图像img的直方图 (b) 参考图像ref的直方图
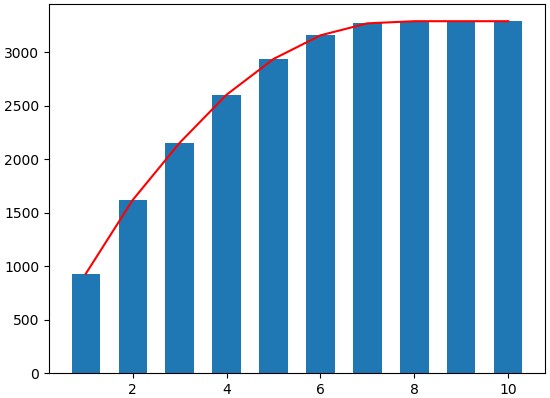

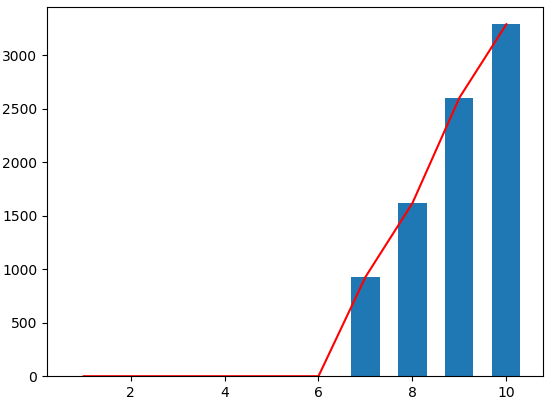
(c) 原图像img的累积直方图 (d) 参考图像ref的累积直方图
| 灰度级 | ref直方图 | ref累积直方图 | img直方图 |
img累积直方图 | 匹配之后的灰度级 |
匹配之后的img累积直方图 |
匹配之后的img直方图 |
| 1 | 0 | 0 | 927 | 927(匹配第三列第七行的1137) | 7 | 0 | 0 |
| 2 | 0 | 0 | 690 | 1617(匹配第三列第八行的1672) | 8 | 0 | 0 |
| 3 | 20 | 20 | 535 | 2152(匹配第三列第九行的2362) | 9 | 0 | 0 |
| 4 | 112 | 132 | 450 | 2602(匹配第三列第九行的2362) | 9 | 0 | 0 |
| 5 | 221 | 353 | 334 | 2936(匹配第三列第十行的3289) | 10 | 0 | 0 |
| 6 | 334 | 687 | 221 | 3157(匹配第三列第十行的3289) | 10 | 0 | 0 |
| 7 | 450 | 1137 | 112 | 3269(匹配第三列第十行的3289) | 10 | 927 | 927 |
| 8 | 535 | 1672 | 20 | 3289(匹配第三列第十行的3289) | 10 | 1617 | 690 |
| 9 | 690 | 2362 | 0 | 3289(匹配第三列第十行的3289) | 10 | 2152 | 985 |
| 10 | 927 | 3289 | 0 | 3289(匹配第三列第十行的3289) | 10 | 3289 | 687 |
img在匹配之后的效果如下:
(a) img的经过匹配之后的累积直方图 (b) img的经过匹配之后的直方图
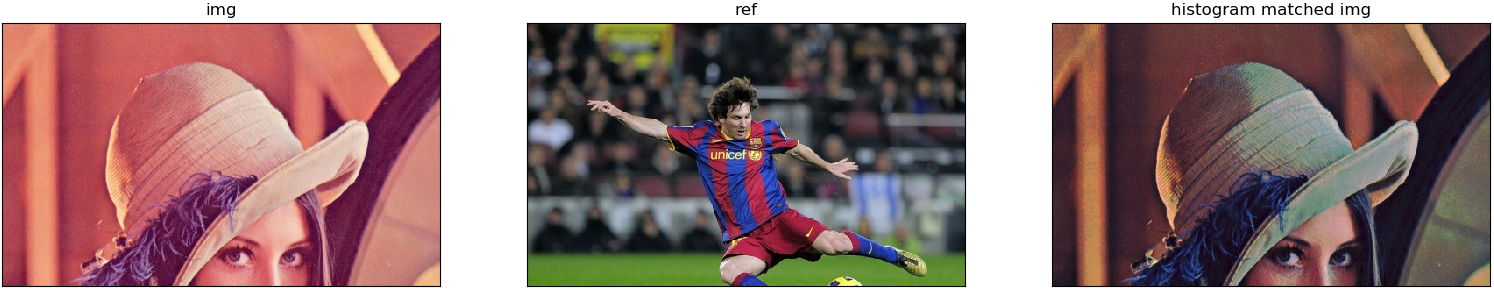
1. OpenCV-Python实现直方图匹配
代码如下:
import cv2
import numpy as np
import matplotlib.pyplot as plt

img = cv2.imread('C:\Users\admin\Desktop\original_img3\testimg\lena_300_500.jpg')
ref = cv2.imread('C:\Users\admin\Desktop\original_img3\testimg\messi_300_500.jpg')

out = np.zeros_like(img)
_, _, colorChannel = img.shape
for i in range(colorChannel):
    print(i)
    hist_img, _ = np.histogram(img[:, :, i], 256)   # get the histogram
    hist_ref, _ = np.histogram(ref[:, :, i], 256)
    cdf_img = np.cumsum(hist_img)   # get the accumulative histogram
    cdf_ref = np.cumsum(hist_ref)

    for j in range(256):
        tmp = abs(cdf_img[j] - cdf_ref)
        tmp = tmp.tolist()
        idx = tmp.index(min(tmp))   # find the smallest number in tmp, get the index of this number
        out[:, :, i][img[:, :, i] == j] = idx

cv2.imwrite('C:\Users\admin\Desktop\lena.jpg', out)
print('Done')
效果如下:
2. matlab实现直方图匹配
程序如下:
clear;
% matching img's histogram to ref's histogram.
path = 'C:\Users\admin\Desktop\original_img3\yijia0923_9\';
ref = imread([path, '18.jpg']);
img = imread([path, '21.jpg']);

[H, W, colorChannel] = size(ref);
out = zeros(H, W, colorChannel);
for k = 1:colorChannel
    disp(k);
    hist_ref = imhist(ref(:, :, k));    % ref的直方图
    cumHist_ref = []; %ref的累积直方图
    for i=1:256
        cumHist_ref = [cumHist_ref sum(hist_ref(1:i))];
    end

    img1 = img(:, :, k);
    hist_img = imhist(img1); %img的直方图
    cumHist_img = []; %img的累积直方图
    for i=1:256
        cumHist_img = [cumHist_img sum(hist_img(1:i))];
    end

    for i=1:256
        tmp{i} = cumHist_ref - cumHist_img(i);
        tmp{i} = abs(tmp{i});               % 找到两个累积直方图距离最近的点
        [a, index(i)] = min(tmp{i});       % a是tmp{i}中最小的值,index是该值对应的下标
    end

    imgn = zeros(H,W);
    for i = 1:H
        for j = 1:W
            imgn(i,j) = index(img1(i,j)+1)-1;    % 由原图的灰度通过索引映射到新的灰度
        end
    end
    out(:, :, k) = imgn;
end

out=uint8(out);
% imwrite(out, [path, 'new3.jpg']);
figure; imshow(out); title('out')
disp('Done');