一、ElasticSearch+FileBeat+Kibana搭建平台
在C# 里面运行程序,输出日志(xxx.log 文本文件)到FileBeat配置的路径下面。
平台搭建,参考之前的随笔。
FileBeat配置如下:


###################### Filebeat Configuration Example #########################

# This file is an example configuration file highlighting only the most common
# options. The filebeat.reference.yml file from the same directory contains all the
# supported options with more comments. You can use it as a reference.
#
# You can find the full configuration reference here:
# https://www.elastic.co/guide/en/beats/filebeat/index.html

# For more available modules and options, please see the filebeat.reference.yml sample
# configuration file.

#=========================== Filebeat inputs =============================

filebeat.inputs:

# Each - is an input. Most options can be set at the input level, so
# you can use different inputs for various configurations.
# Below are the input specific configurations.

- type: log

# Paths that should be crawled and fetched. Glob based paths.
  #paths:
    #- E:filebeat-6.6.2-windows-x86_64datalogstash-tutorial.log*.log
    #- c:programdataelasticsearchlogs*

  paths:
    - E:ELKLoglog*.log
#- type: redis
  #hosts: ["localhost:6379"]
  #password: "hy900511@"

  # Change to true to enable this input configuration.
  enabled: true

  #scan_frequency: 5s


  # Exclude lines. A list of regular expressions to match. It drops the lines that are
  # matching any regular expression from the list.
  #exclude_lines: ['^DBG']

  # Include lines. A list of regular expressions to match. It exports the lines that are
  # matching any regular expression from the list.
  #include_lines: ['^ERR', '^WARN']

  # Exclude files. A list of regular expressions to match. Filebeat drops the files that
  # are matching any regular expression from the list. By default, no files are dropped.
  #exclude_files: ['.gz$']

  # Optional additional fields. These fields can be freely picked
  # to add additional information to the crawled log files for filtering
  #fields:
  #  level: debug
  #  review: 1

  ### Multiline options

  # Multiline can be used for log messages spanning multiple lines. This is common
  # for Java Stack Traces or C-Line Continuation

  # The regexp Pattern that has to be matched. The example pattern matches all lines starting with [
  #multiline.pattern: ^[

  # Defines if the pattern set under pattern should be negated or not. Default is false.
  #multiline.negate: false

  # Match can be set to "after" or "before". It is used to define if lines should be append to a pattern
  # that was (not) matched before or after or as long as a pattern is not matched based on negate.
  # Note: After is the equivalent to previous and before is the equivalent to to next in Logstash
  #multiline.match: after


#============================= Filebeat modules ===============================

filebeat.config.modules:
  # Glob pattern for configuration loading
  path: ${path.config}/modules.d/*.yml

  # Set to true to enable config reloading
  reload.enabled: false

  # Period on which files under path should be checked for changes
  #reload.period: 10s

#==================== Elasticsearch template setting ==========================

setup.template.settings:
  index.number_of_shards: 3
  #index.codec: best_compression
  #_source.enabled: false

#================================ General =====================================

# The name of the shipper that publishes the network data. It can be used to group
# all the transactions sent by a single shipper in the web interface.
#name:

# The tags of the shipper are included in their own field with each
# transaction published.
#tags: ["service-X", "web-tier"]

# Optional fields that you can specify to add additional information to the
# output.
#fields:
#  env: staging


#============================== Dashboards =====================================
# These settings control loading the sample dashboards to the Kibana index. Loading
# the dashboards is disabled by default and can be enabled either by setting the
# options here, or by using the `-setup` CLI flag or the `setup` command.
#setup.dashboards.enabled: false

# The URL from where to download the dashboards archive. By default this URL
# has a value which is computed based on the Beat name and version. For released
# versions, this URL points to the dashboard archive on the artifacts.elastic.co
# website.
#setup.dashboards.url:

#============================== Kibana =====================================

# Starting with Beats version 6.0.0, the dashboards are loaded via the Kibana API.
# This requires a Kibana endpoint configuration.
setup.kibana:

  # Kibana Host
  # Scheme and port can be left out and will be set to the default (http and 5601)
  # In case you specify and additional path, the scheme is required: http://localhost:5601/path
  # IPv6 addresses should always be defined as: https://[2001:db8::1]:5601
  #host: "localhost:5601"

  # Kibana Space ID
  # ID of the Kibana Space into which the dashboards should be loaded. By default,
  # the Default Space will be used.
  #space.id:

#============================= Elastic Cloud ==================================

# These settings simplify using filebeat with the Elastic Cloud (https://cloud.elastic.co/).

# The cloud.id setting overwrites the `output.elasticsearch.hosts` and
# `setup.kibana.host` options.
# You can find the `cloud.id` in the Elastic Cloud web UI.
#cloud.id:

# The cloud.auth setting overwrites the `output.elasticsearch.username` and
# `output.elasticsearch.password` settings. The format is `<user>:<pass>`.
#cloud.auth:

#================================ Outputs =====================================

# Configure what output to use when sending the data collected by the beat.

#-------------------------- Elasticsearch output ------------------------------
output.elasticsearch:
  # Array of hosts to connect to.
  hosts: ["localhost:9200"]

  # Enabled ilm (beta) to use index lifecycle management instead daily indices.
  #ilm.enabled: false

  # Optional protocol and basic auth credentials.
  #protocol: "https"
  #username: "elastic"
  #password: "changeme"

#----------------------------- Logstash output --------------------------------
#output.logstash:
  # The Logstash hosts
  #hosts: ["localhost:5044"]

  # Optional SSL. By default is off.
  # List of root certificates for HTTPS server verifications
  #ssl.certificate_authorities: ["/etc/pki/root/ca.pem"]

  # Certificate for SSL client authentication
  #ssl.certificate: "/etc/pki/client/cert.pem"

  # Client Certificate Key
  #ssl.key: "/etc/pki/client/cert.key"

#================================ Processors =====================================

# Configure processors to enhance or manipulate events generated by the beat.

processors:
  - add_host_metadata: ~
  - add_cloud_metadata: ~

#================================ Logging =====================================

# Sets log level. The default log level is info.
# Available log levels are: error, warning, info, debug
#logging.level: debug

# At debug level, you can selectively enable logging only for some components.
# To enable all selectors use ["*"]. Examples of other selectors are "beat",
# "publish", "service".
#logging.selectors: ["*"]

#============================== Xpack Monitoring ===============================
# filebeat can export internal metrics to a central Elasticsearch monitoring
# cluster.  This requires xpack monitoring to be enabled in Elasticsearch.  The
# reporting is disabled by default.

# Set to true to enable the monitoring reporter.
#xpack.monitoring.enabled: false

# Uncomment to send the metrics to Elasticsearch. Most settings from the
# Elasticsearch output are accepted here as well. Any setting that is not set is
# automatically inherited from the Elasticsearch output configuration, so if you
# have the Elasticsearch output configured, you can simply uncomment the
# following line.
#xpack.monitoring.elasticsearch:
以上程序都在 服务启动着。
然后在C#中,执行程序将 日志保存到 E:ELKLoglog
【注意:Filebeat是以行来识别日志的更改,所以将日志的同一段话以行写入】
在Kibana中看到:
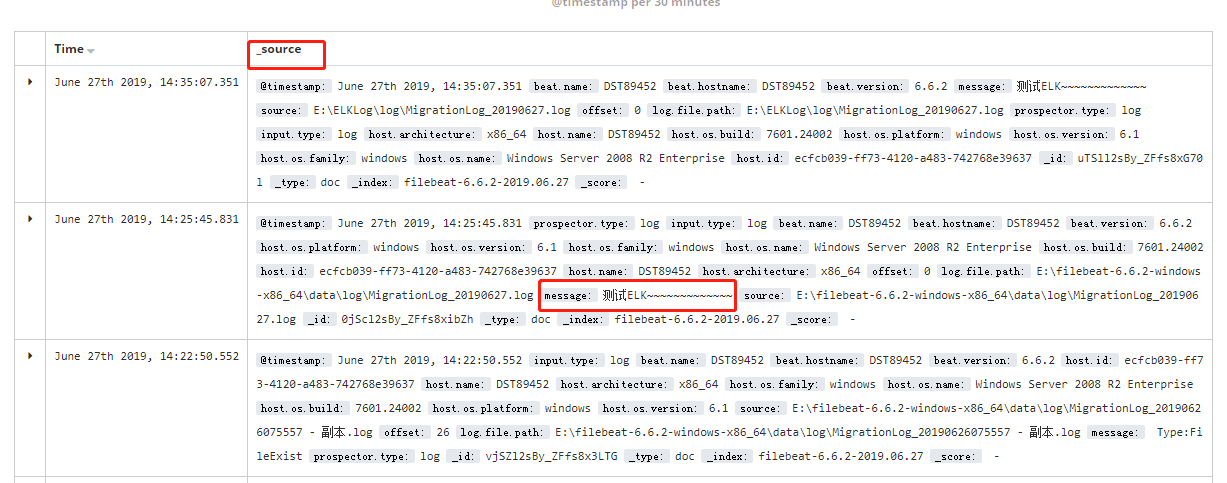
_source字段拆分需要用到logstash。
二、配置Filebeat多行合并
一些错误日志,都是自动换行的。不配置的话 本来是一条日志的,在ES中就显示成了多条
于是配置multiline参数;
###################### Filebeat Configuration Example #########################

# This file is an example configuration file highlighting only the most common
# options. The filebeat.reference.yml file from the same directory contains all the
# supported options with more comments. You can use it as a reference.
#
# You can find the full configuration reference here:
# https://www.elastic.co/guide/en/beats/filebeat/index.html

# For more available modules and options, please see the filebeat.reference.yml sample
# configuration file.

#=========================== Filebeat inputs =============================

filebeat.inputs:

# Each - is an input. Most options can be set at the input level, so
# you can use different inputs for various configurations.
# Below are the input specific configurations.

- type: log

# Paths that should be crawled and fetched. Glob based paths.
  #paths:
    #- E:filebeat-6.6.2-windows-x86_64datalogstash-tutorial.log*.log
    #- c:programdataelasticsearchlogs*

  paths:
    - E:ELKLoglog*.log
#- type: redis
  #hosts: ["localhost:6379"]
  #password: "hy900511@"

  # Change to true to enable this input configuration.
  enabled: true

  #scan_frequency: 5s


  # Exclude lines. A list of regular expressions to match. It drops the lines that are
  # matching any regular expression from the list.
  #exclude_lines: ['^DBG']

  # Include lines. A list of regular expressions to match. It exports the lines that are
  # matching any regular expression from the list.
  #include_lines: ['^ERR', '^WARN']

  # Exclude files. A list of regular expressions to match. Filebeat drops the files that
  # are matching any regular expression from the list. By default, no files are dropped.
  #exclude_files: ['.gz$']

  # Optional additional fields. These fields can be freely picked
  # to add additional information to the crawled log files for filtering
  #fields:
  #  level: debug
  #  review: 1

  ### Multiline options

  # Multiline can be used for log messages spanning multiple lines. This is common
  # for Java Stack Traces or C-Line Continuation

  # The regexp Pattern that has to be matched. The example pattern matches all lines starting with [
  multiline.pattern: '^Time'

  # Defines if the pattern set under pattern should be negated or not. Default is false.
  multiline.negate: true

  # Match can be set to "after" or "before". It is used to define if lines should be append to a pattern
  # that was (not) matched before or after or as long as a pattern is not matched based on negate.
  # Note: After is the equivalent to previous and before is the equivalent to to next in Logstash
  multiline.match: after
  # max_lines: 500
  # timeout: 5s


#============================= Filebeat modules ===============================

filebeat.config.modules:
  # Glob pattern for configuration loading
  path: ${path.config}/modules.d/*.yml

  # Set to true to enable config reloading
  reload.enabled: false

  # Period on which files under path should be checked for changes
  #reload.period: 10s

#==================== Elasticsearch template setting ==========================

setup.template.settings:
  index.number_of_shards: 3
  #index.codec: best_compression
  #_source.enabled: false

#================================ General =====================================

# The name of the shipper that publishes the network data. It can be used to group
# all the transactions sent by a single shipper in the web interface.
#name:

# The tags of the shipper are included in their own field with each
# transaction published.
#tags: ["service-X", "web-tier"]

# Optional fields that you can specify to add additional information to the
# output.
#fields:
#  env: staging


#============================== Dashboards =====================================
# These settings control loading the sample dashboards to the Kibana index. Loading
# the dashboards is disabled by default and can be enabled either by setting the
# options here, or by using the `-setup` CLI flag or the `setup` command.
#setup.dashboards.enabled: false

# The URL from where to download the dashboards archive. By default this URL
# has a value which is computed based on the Beat name and version. For released
# versions, this URL points to the dashboard archive on the artifacts.elastic.co
# website.
#setup.dashboards.url:

#============================== Kibana =====================================

# Starting with Beats version 6.0.0, the dashboards are loaded via the Kibana API.
# This requires a Kibana endpoint configuration.
setup.kibana:

  # Kibana Host
  # Scheme and port can be left out and will be set to the default (http and 5601)
  # In case you specify and additional path, the scheme is required: http://localhost:5601/path
  # IPv6 addresses should always be defined as: https://[2001:db8::1]:5601
  #host: "localhost:5601"

  # Kibana Space ID
  # ID of the Kibana Space into which the dashboards should be loaded. By default,
  # the Default Space will be used.
  #space.id:

#============================= Elastic Cloud ==================================

# These settings simplify using filebeat with the Elastic Cloud (https://cloud.elastic.co/).

# The cloud.id setting overwrites the `output.elasticsearch.hosts` and
# `setup.kibana.host` options.
# You can find the `cloud.id` in the Elastic Cloud web UI.
#cloud.id:

# The cloud.auth setting overwrites the `output.elasticsearch.username` and
# `output.elasticsearch.password` settings. The format is `<user>:<pass>`.
#cloud.auth:

#================================ Outputs =====================================

# Configure what output to use when sending the data collected by the beat.

#-------------------------- Elasticsearch output ------------------------------
output.elasticsearch:
  # Array of hosts to connect to.
  hosts: ["localhost:9200"]

  # Enabled ilm (beta) to use index lifecycle management instead daily indices.
  #ilm.enabled: false

  # Optional protocol and basic auth credentials.
  #protocol: "https"
  #username: "elastic"
  #password: "changeme"

#----------------------------- Logstash output --------------------------------
#output.logstash:
  # The Logstash hosts
  #hosts: ["localhost:5044"]

  # Optional SSL. By default is off.
  # List of root certificates for HTTPS server verifications
  #ssl.certificate_authorities: ["/etc/pki/root/ca.pem"]

  # Certificate for SSL client authentication
  #ssl.certificate: "/etc/pki/client/cert.pem"

  # Client Certificate Key
  #ssl.key: "/etc/pki/client/cert.key"

#================================ Processors =====================================

# Configure processors to enhance or manipulate events generated by the beat.

processors:
  - add_host_metadata: ~
  - add_cloud_metadata: ~

#================================ Logging =====================================

# Sets log level. The default log level is info.
# Available log levels are: error, warning, info, debug
#logging.level: debug

# At debug level, you can selectively enable logging only for some components.
# To enable all selectors use ["*"]. Examples of other selectors are "beat",
# "publish", "service".
#logging.selectors: ["*"]

#============================== Xpack Monitoring ===============================
# filebeat can export internal metrics to a central Elasticsearch monitoring
# cluster.  This requires xpack monitoring to be enabled in Elasticsearch.  The
# reporting is disabled by default.

# Set to true to enable the monitoring reporter.
#xpack.monitoring.enabled: false

# Uncomment to send the metrics to Elasticsearch. Most settings from the
# Elasticsearch output are accepted here as well. Any setting that is not set is
# automatically inherited from the Elasticsearch output configuration, so if you
# have the Elasticsearch output configured, you can simply uncomment the
# following line.
#xpack.monitoring.elasticsearch:
配置中表示:
以Time开头的行是一条完整日志的开始,它和后面多个不以Time开头的行组成一条完整日志;【因为我的日志message都是以Time= 开头,所以这样配置】
参考:应该怎样正确配置filebeat文件(包括multiline、input_type等)
结果如下:
