最近需要绘制基因调控网络,选择了python语言中比较popular的networkx包,先上目前结果图:
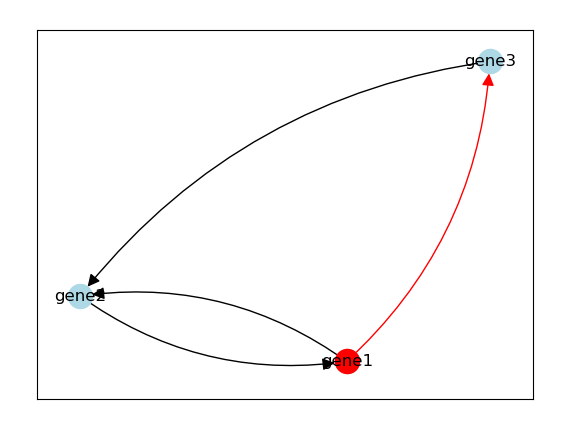
节点是基因或者其他实体,边代表调控关系,黑色的边代表抑制,红色的边代表激活,红色的节点代表自我激活,黑色的节点代表自我抑制。
绘制的关键点:边可以有不同的颜色,指向符号可以修改,可以绘制出自循环的边(self-loop)
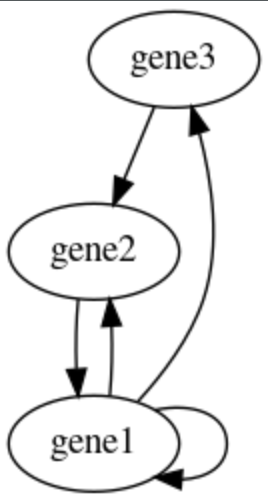
本来抑制的边用截止符号-[更好,但是发现有时候看不清是来自哪条边的,所以就都改成箭头了,用颜色来区别关系;然后花了n久来找怎么绘制自循环的边,发现networkx的draw相关的方法 (基于matplotlib) 并不能显示(虽然我定义了节点n到节点n的边,但是结果不显示),查了一大堆发现确实是不支持的,好像说难实现还是咋回事...目前我已知的解决办法就是用另外一个绘图包graphviz,如该链接问题:https://stackoverflow.com/questions/49340520/matplotlib-and-networkx-drawing-a-self-loop-node
 (networkx的绘图包)
我试了一下,确实可以,但效果没有之前好,所以决定换一种思路,用颜色代表自循环吧,用graphviz结果如下:
目前结果的代码如下:
 1 import networkx as nx
 2 import matplotlib.pyplot as plt
 3
 4 with open('grn_sample.txt', 'r', encoding='UTF-8') as fread:
 5     cont = fread.readlines()
 6     contLines = []
 7     genes = set()
 8     G = nx.MultiDiGraph()
 9     pEdges = []
10     nEdges = []
11     for line in cont:
12         tmp = line.strip().split(' ')
13         genes.add(tmp[0])
14         genes.add(tmp[1])
15         contLines.append(tmp)
16     genes = list(genes)
17     selfActGenes=set()
18     selfInhGenes=set()
19     G.add_nodes_from(genes)
20     for edge in contLines:
21         row = genes.index(edge[0])
22         col = genes.index(edge[1])
23         if edge[2] == '+':
24             pEdges.append((edge[0], edge[1]))
25             if row==col:
26                 selfActGenes.add(edge[0])
27         elif edge[2] == '-':
28             nEdges.append((edge[0], edge[1]))
29             if row==col:
30                 selfInhGenes.add(edge[0])
31         else:
32             print('Unsupported regulatory relationship.')
33     selfActGenes=list(selfActGenes)
34     selfInhGenes=list(selfInhGenes)
35     # show grn by network visualization
36     G.add_edges_from(pEdges)
37     G.add_edges_from(nEdges)
38     pos=nx.spring_layout(G) # 很重要!
39     nx.draw_networkx_nodes(G,pos,node_color='lightblue') # initial colors for all nodes
40     nx.draw_networkx_nodes(G, pos, nodelist=selfActGenes, node_color='red') # self-active nodes with red colors
41     nx.draw_networkx_nodes(G, pos, nodelist=selfInhGenes, node_color='black') # self-inhibited nodes with black colors
42     nx.draw_networkx_labels(G,pos)
43     nx.draw_networkx_edges(G,pos,edgelist=pEdges,edge_color='red',connectionstyle='arc3,rad=0.2',arrowsize=18)
44     nx.draw_networkx_edges(G, pos, edgelist=nEdges, edge_color='black',arrows=True,connectionstyle='arc3,rad=0.2',arrowsize=18)
45     plt.show()
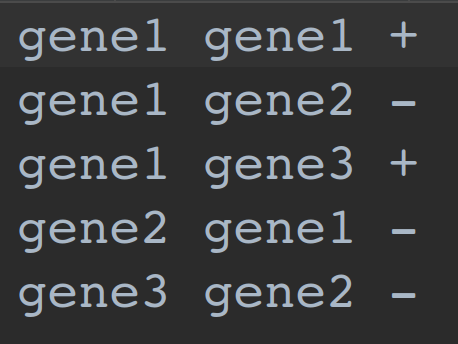
读入文件如下(仅仅定义边):
如果你需要使用截止符号,只需要在draw边的函数中定义参数arrowstyle,具体可以看官方文档,非常清晰: https://networkx.github.io/documentation/stable/reference/generated/networkx.drawing.nx_pylab.draw_networkx_edges.html
P.S. 对了,这次根据所需效果查询发现了直接看查询结果中图片结果的好处,可以通过图片直观的找到你要的效果所在的网页,节省很多时间。
