极坐标作图不像直角坐标作图那么容易,所以极坐标作图有专门的软件,比如EMCAR和Polar Chart, 前者是开源的,有兴趣的伙伴们可以去sourceforge下载: Antenna Measurement Range Using LinuxCNC, 但是目前版本比较低,至今依然是 2015-10-09 上传emcar-0.1.tar, 可能还是对一些特定问题进行处理;后者是收费软件,图形界面比较美观,但是从它的输入界面来看,貌似只能对有规律的函数做图,有点像给教学演示做的数学软件。一般搞科研工作者或工程师面对的实际上具有极坐标性质的数据集,但是形态各异,情况复杂。Gnuplot就具有这样强大的功能,例如:
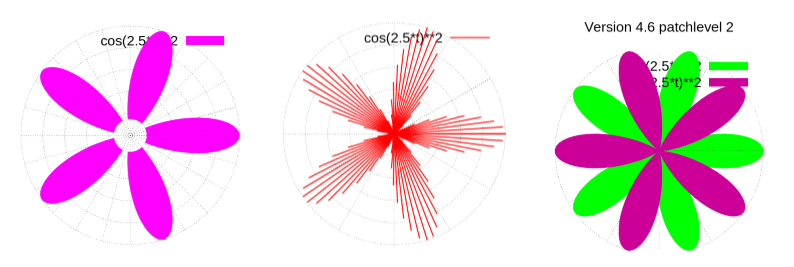
上面三个图的输入文件分别是:
set polar
unset tics
set rtics 0.2 format ""
set border 0 lt 0
set grid polar pi/12
set term pngcairo enh font "Arial,20" size 500,500
set out "polar_filledcurves.png"
set size ratio -1
set rrange [0:1]
set samp 200
plot cos(2.5*t)**2 w filledc above r=0.15 lc rgb "magenta"
和
set polar
set border 0 lt 0
unset tics
set rtics 0.2 format ""
set grid polar
set term pngcairo enh font "Arial,20" size 500,500
set out "polar_impulses.png"
set size ratio -1
set rrange [0:1]
plot cos(2.5*t)**2 w imp  lw 2
以及
set polar
unset tics
set rtics format ""
set grid polar
set border 0 lt 0
set term pngcairo enh font "Arial,20" size 500,500
set out "polar_alpha.png"
set size ratio -1
set samp 200
set title "Version 4.6 patchlevel 2" font ",20"
plot cos(2.5*t)**2 w filledc lc rgb "green",
     sin(2.5*t)**2 w filledc lc rgb "#80cc0099"
你会发现,这些图依然缺少什么,对了,就是坐标标注,像下面这样的:
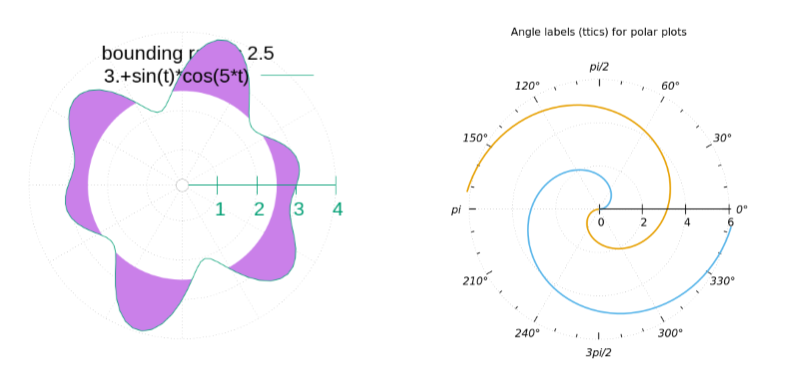
他们的绘图语句集分别为
set polar
set grid polar
unset xtics
unset ytics
set border 0.9 lt 2
set term pngcairo enh font "Arial,20" size 500,500
set out "polar_fig1.png"
set style fill solid 0.5
set rrange [0.1 : 4]
set size square
set key title "bounding radius 2.5"
# set key outside top right samplen 0.7
plot 3.+sin(t)*cos(5*t) with filledcurve above r=2.5 notitle,
     3.+sin(t)*cos(5*t) with line
和
set ter pngcairo enh lw 1.2 color size 600,550
set output 'polar.png'
set title "Angle labels (ttics) for polar plots" offset 0,1
set polar
set ttics 0,30 format "%g".GPVAL_DEGREE_SIGN font ":Italic"
set mttics 3
set grid r polar 60
unset xtics
unset ytics
set border 0
set size square
unset key
set rrange [0:6.1]
if (GPVAL_ENCODING eq "utf8") {
    set ttics add ("π" 180, "π/2" 90, "3π/2" 270)
} else {
    set ttics add ("pi" 180, "pi/2" 90, "3pi/2" 270)
}
plot t lt 3 lw 2, -t lt 4 lw 2
set title "Polar plot with border and rotated labels for ttics"
set ttics rotate
set rrange [0:6.5]
set border polar
replot
但是,这种图依旧不尽人意:首先是坐标网格基本看不见,其次坐标标注的字体很难随意改动。大多数伙伴都认为继续优化上面的代码估计就可以做出非常美观的图片了,其实不然,比如上面左图的代码去掉,你会发现图像比例严重失调。其实上面第一排图的第三个严格上使用gnuplot的4.7版本做的,4.6就有些勉为其难了。而第二排图的第一个是在5.0版本中做的(gnuplot version gnuplot 5.0 patchlevel 5),第二个本应该在5.4版本中做的(gnuplot version gnuplot 5.4.rc0 patchlevel rc0),它们在4.6版本中是实现不了的,我是在5.2版本中做的(北京超算云D分区-BSCC-D):
    G N U P L O T
    Version 5.2 patchlevel 7    last modified 2019-05-29

    Copyright (C) 1986-1993, 1998, 2004, 2007-2018
    Thomas Williams, Colin Kelley and many others

    gnuplot home:     http://www.gnuplot.info
    faq, bugs, etc:   type "help FAQ"
    immediate help:   type "help"  (plot window: hit 'h')
因此,从应用便捷程度来说,gnuplot的强大功能在极坐标情形下已经不怎么灵活了,而且不能总是遇到一种新的情况就升级一下软件的。所以,下一个目录先展示一种在gnuplot低版本中可以灵活处理但比较繁琐的方式,再来探讨下怎么利用Matlab来实现想要的效果。
参考链接:
[1] A new and improved Emacs gnuplot DSL;Enhanced Machine Controller Antenna Range (EMCAR)
[2] gnuplot demo script: ttics.dem;gnuplot demo script-polar.dem;2次元極座標系;Polar Chart
[3] Generated on 08-Jan-2020 20:52:28 by html_compare_plot_demos with GNU Octave 6.0.0