OpenCensus
Easily collect telemetry like metrics and distributed traces from your services
OpenCensus and OpenTracing have merged to form OpenTelemetry, which serves as the next major version of OpenCensus and OpenTracing. OpenTelemetry will offer backwards compatibility with existing OpenCensus integrations, and we will continue to make security patches to existing OpenCensus libraries for two years.
What is OpenCensus?
![]() OpenCensus is a set of libraries for various languages that allow you to collect application metrics and distributed traces, then transfer the data to a backend of your choice in real time. This data can be analyzed by developers and admins to understand the health of the application and debug problems.
OpenCensus is a set of libraries for various languages that allow you to collect application metrics and distributed traces, then transfer the data to a backend of your choice in real time. This data can be analyzed by developers and admins to understand the health of the application and debug problems.
How can I use OpenCensus in my project?
We provide libraries for Go, Java, C#, Node.js, C++, Ruby, Erlang/Elixir, Python, Scala and PHP.
Supported backends include Azure Monitor, Datadog, Instana, Jaeger, SignalFX, Stackdriver, and Zipkin. You can also add support for other backends.
Who is behind it?
OpenCensus originates from Google, where a set of libraries called Census are used to automatically capture traces and metrics from services. Since going open source, the project is now composed of a group of cloud providers, application performance management vendors, and open source contributors. The project is hosted on GitHuband all work occurs there.
What data can OpenCensus collect?
Metrics are any quantifiable piece of data that you would like to track, such as latency in a service or database, request content length, or number of open file descriptors. Viewing graphs of your metrics can help you understand and gauge the performance and overall quality of your application and set of services.
Traces show you how a request propagates throughout your application or set of services. Viewing graphs of your traces can help you understand the bottlenecks in your architecture by visualizing how data flows between all of your services.
Other types of telemetry will be added to OpenCensus as the project matures. Logs will likely be added next.
Introduction
![]() OpenCensus makes getting critical telemetry out of your services easy and seamless. OpenCensus currently provides libraries for a number of languages that allow you to capture, manipulate, and export metrics and distributed traces to the backend(s) of your choice. OpenCensus works great with all software systems, from client applications, large monoliths, or highly-distributed microservices. OpenCensus started at Google but is now developed by a broad community of service developers, cloud vendors, and community contributors. OpenCensus isn’t tied to any particular vendor’s backend or analysis system.
OpenCensus makes getting critical telemetry out of your services easy and seamless. OpenCensus currently provides libraries for a number of languages that allow you to capture, manipulate, and export metrics and distributed traces to the backend(s) of your choice. OpenCensus works great with all software systems, from client applications, large monoliths, or highly-distributed microservices. OpenCensus started at Google but is now developed by a broad community of service developers, cloud vendors, and community contributors. OpenCensus isn’t tied to any particular vendor’s backend or analysis system.
In this section we will walk through what OpenCensus is, what problems it solves, and how it can help your project.
Or, if you are ready to integrate OpenCensus in to your project, visit the Quickstart.
Overview
OpenCensus provides observability for your microservices and monoliths alike by tracing requests as they propagate through services and capturing critical time-series metrics.
The core functionality of OpenCensus is the ability to collect traces and metrics from your app, display them locally, and send them to any analysis tool (also called a ‘backend’). However, OpenCensus provides more than just data insight. This page describes some of that functionality and points you to resources for building it into your app.
After instrumenting your code with OpenCensus, you will equip yourself with the ability to optimize the speed of your services, understand exactly how a request travels between your services, gather any useful metrics about your entire architecture, and more.
Features
Context Propagation
In order to correlate activities and requests between services with an initial customer action, context (usually in the form of trace or correlation ID) must be propagated throughout your systems. Performing this automatically can be quite difficult, and a lack of automatic context propagation is often identified as the biggest blocker to an organization adopting distributed tracing. OpenCensus provides automatic context propagation across its supported languages and frameworks, and provides simple APIs for manually propagating or manipulating context.
OpenCensus supports several different context propagation formats, and is the reference implementation of the official W3C HTTP tracing header.
Distributed Trace Collection
OpenCensus captures and propagates distributed traces through your system, allowing you to visualize how customer requests flow across services, rapidly perform deep root cause analysis, and better analyze latency across a highly distributed set of services. OpenCensus includes functionality like context propagation and sampling out of the box and can interoperate with a variety of tracing systems. You can learn more about OpenCensus’ distributed tracing support here.
Time-series Metrics Collection
OpenCensus captures critical time series statistics from your application, including the latency, request count, and request size for each endpoint. Once captured, these individual statistics can be aggregated into metrics with time windows and dimensions of your choosing.
APIs
OpenCensus provides APIs for all telemetry types. For example, you can use these to define and capture custom metrics, add additional spans or annotations to traces, define custom trace sampling policy, switch context propagation formats, etc.
Integrations
OpenCensus contains an incredible amount of integrations out of the box. These allow traces and metrics to be captured from popular RPC systems, web frameworks, and storage clients.
Single Project and Implementation
While OpenCensus is an open source project with an incredibly active community, it also benefits from maintaining a single distribution for each language. This means that contributions are focused, that efforts are not wasted on multiple competing implementations (particularly important for integrations), and that as much functionality is available out of the box as possible.
Low Overhead
OpenCensus is used in production at some of the largest companies in the world, and as such it strives to have as small of a performance impact as possible.
Backend Support
OpenCensus can upload data to almost any backend with its various exporter implementations. If you’re using a backend that isn’t supported yet (such as an analysis system built specifically for your organization), you can also implement your own quickly and easily. Read more.
By completing this quickstart, you will learn how to:
- Collect metrics from your services
- Trace a request as it passes through your services
- Export your data to one of our supported backends
C#
In this quickstart, using OpenCensus C#, you will gain hands-on experience with:
For full API references, please take a look at:
| RESOURCE | LINK |
|---|---|
| Github repository | https://github.com/census-instrumentation/opencensus-csharp |
- Prerequisites
- Run it locally
- Configure Exporter
- Configure Sampler
- Using the Tracer
- Create a Span
- Create a Child Span
- Shutdown the Tracer
- References
Prerequisites
- .NET Core 2.0+ .NET Framework 4.6.1+ is also supported.
- Docker for Desktop
Run it locally
- Clone the Opencensus C# repository:
git clone https://github.com/census-instrumentation/opencensus-csharp.git - Change to the example directory:
cd src/Samples - Build the sample by
dotnet build - Run Zipkin in Docker container:
docker run -d -p 9411:9411 openzipkin/zipkin - If you don’t have “Docker for Desktop” installed, follow this:
https://zipkin.io/pages/quickstart dotnet run zipkin --uri=http://localhost:9411/api/v2/spans- Navigate to Zipkin Web UI:
http://localhost:9411 - Click Find Traces, and you should see a trace.
- Click into that, and you should see the details.

Configure Exporter
OpenCensus can export traces to different distributed tracing stores (such as Zipkin, Jeager, Stackdriver Trace). In (1), we configure OpenCensus to export to Zipkin, which is listening on localhost port 9411, and all of the traces from this program will be associated with a service name tracing-to-zipkin-service.
// 1. Configure exporter to export traces to Zipkin.
ZipkinTraceExporter.createAndRegister(
    "http://localhost:9411/api/v2/spans", "tracing-to-zipkin-service");
You can export trace data to different backends. Learn more in OpenCensus Supported Exporters.
Configure Sampler
Configure 100% sample rate, otherwise, few traces will be sampled.
// 2. Configure 100% sample rate, otherwise, few traces will be sampled.
ITraceConfig traceConfig = Tracing.TraceConfig;
ITraceParams currentConfig = traceConfig.ActiveTraceParams;
var newConfig = currentConfig.ToBuilder()
    .SetSampler(Samplers.AlwaysSample)
    .Build();
traceConfig.UpdateActiveTraceParams(newConfig);
There are multiple ways to configure how OpenCensus sample traces. Learn more in OpenCensus Sampling.
Using the Tracer
To start a trace, you first need to get a reference to the Tracer (3). It can be retrieved as a global singleton.
// 3. Tracer is global singleton. You can register it via dependency injection if it exists
// but if not - you can use it as follows:
var tracer = Tracing.Tracer;
Create a Span
To create a span in a trace, we used the Tracer to start a new span (4). A span must be closed in order to mark the end of the span. A scoped span (Scope) implements IDisposable, so when used within a using block, the span will be closed automatically when exiting the block.
// 4. Create a scoped span, a scoped span will automatically end when closed.
// It implements AutoClosable, so it'll be closed when the try block ends.
using (var scope = tracer.SpanBuilder("Main").StartScopedSpan())
{
    Console.WriteLine("About to do a busy work");
    for (int i = 0; i < 10; i++)
    {
        DoWork(i);
    }
}
Create a Child Span
The Run method calls DoWork a number of times. Each invocation also generates a child span. Take a look at DoWorkmethod.
private static void DoWork(int i)
{
    // 6. Get the global singleton Tracer object
    ITracer tracer = Tracing.Tracer;

    // 7. Start another span. If another span was already started, it'll use that span as the parent span.
    // In this example, the main method already started a span, so that'll be the parent span, and this will be
    // a child span.
    using (OpenCensus.Common.IScope scope = tracer.SpanBuilder("DoWork").StartScopedSpan())
    {
        // Simulate some work.
        ISpan span = tracer.CurrentSpan;

        try
        {
            Console.WriteLine("Doing busy work");
            Thread.Sleep(1000);
        }
        catch (ArgumentOutOfRangeException e)
        {
            // 6. Set status upon error
            span.Status = Status.Internal.WithDescription(e.ToString());
        }

        // 7. Annotate our span to capture metadata about our operation
        var attributes = new Dictionary<string, IAttributeValue>();
        attributes.Add("use", AttributeValue.StringAttributeValue("demo"));
        span.AddAnnotation("Invoking DoWork", attributes);
    }
}
Shutdown the Tracer
Traces are queued up in memory and flushed to the trace store (in this case, Zipkin) periodically, and/or when the buffer is full. In (5), we need to make sure that any buffered traces that had yet been sent are flushed for a graceful shutdown
/ 5. Gracefully shutdown the exporter so it'll flush queued traces to Zipkin.
Tracing.ExportComponent.SpanExporter.Dispose();
Set the Status of the span
We can set the status of our span to create more observability of our traced operations.
// 6. Set status upon error
span.Status = Status.Internal.WithDescription(e.ToString());
Create an Annotation
References
| Resource | URL |
|---|---|
| Zipkin project | https://zipkin.io/ |
| Setting up Zipkin | Zipkin Codelab |
| Zipkin C# exporter | https://www.nuget.org/packages/OpenCensus.Exporter.Zipkin |
| C# exporters | C# exporters |
| OpenCensus C# Trace package | https://www.nuget.org/packages/OpenCensus/ |
Tracing
Tracing
Tracing tracks the progression of a single user request as it is handled by other services that make up an application.
Each unit work is called a Span in a trace. Spans include metadata about the work, including the time spent in the step (latency), status, time events, attributes, links. You can use tracing to debug errors and latency issues in your applications.
Trace
A trace is a tree of spans. It is a collective of observable signals showing the path of work through a system. A trace on its own is distinguishable by a unique 16 byte sequence called a TraceID.
This TraceID groups and distinguishes spans. We’ll learn about spans shortly.
This is an example of what a trace looks like:

Above, you see a trace with various spans. In order to respond to /messages, several other internal requests are made. Firstly, we check if the user is authenticated. Next we check if their messages were cached. Since their message wasn’t cached, that’s a cache miss and we then fetch their content from MySQL, cache it and then provide the response containing their messages.
xporting
Recorded spans can be exported by registered exporters.
Multiple exporters can be registered to upload the data to various different backends. Users can unregister the exporters if they are no longer needed.
Please visit the page exporters to learn more about exporters.
References
| Resource | URL |
|---|---|
| Trace specs | specs/Trace |
| Trace proto definition | proto/Trace/v1 |
Span
Span
A span represents a single operation in a trace. A span could be representative of an HTTP request, a remote procedure call (RPC), a database query, or even the path that a code takes in user code, etc.
For example:

Above, you can see a trace with various spans. In order to respond to /messages, several other internal requests are made. Firstly, we check if the user is authenticated. Next we check if their messages were cached. Since their message wasn’t cached, that’s a cache miss and we then fetch their content from MySQL, cache it and then provide the response containing their messages.
A span may or may not have a parent span:
- A span without a parent is called a “root span” for example, span “/messages”
- A span with a parent is called a “child span” for example, spans “auth”, “cache.Get”, “mysql.Query”, “cache.Put”
Spans are identified by a SpanID and each span belongs to a single trace. Each trace is uniquely identified by a TraceID which all constituent spans will share.
These identifiers and options byte together are called Span Context. Inside the same process, Span context is propagated in a context object. When crossing process boundaries, it is serialized into protocol headers. The receiving end can read the Span context and create child spans.
A span consists of the following fields:
- Name
- SpanID
- TraceID
- ParentSpanID
- StartTime/EndTime
- Status
- Time events
- Link
- SpanKind
- TraceOptions
- Tracestate
References
| Resource | URL |
|---|---|
| Span specs | specs/Tracing/Span |
| Span proto definition | proto/trace/v1/Span.proto |
Name
Name
A span name is a string descriptive of what the span does. Span names should be statistically meaningful. Most tracing backend and analysis tools use span names to auto generate reports for the represented work.
Examples of span names:
- “cache.Get” represents the Get method of the cache service.
- ”/messages” represents the messages web page.
- ”/api/user/(d+)” represents the user detail pages.
Names are usually created in the span’s constructor.
Source code sample
We’ll create a span with the Name “cache.Get”, below:
try (Scope ss = TRACER.spanBuilder("cache.Get").startScopedSpan()) {
}
Visuals
The span when visualized will look something like this:

eferences
| Resource | URL |
|---|---|
| Name in datamodel reference | proto/v1/Span.Name |
SpanID
SpanID
SpanID is the span’s unique identifier. It consists of 8 randomly generated bytes and MUST be globally unique.
This field is REQUIRED for every span.
Relation to ParentSpanID
SpanID is the identifier passed along to ParentSpanID when creating a child span.
- If Span A with SpanIDA is the parent of Span B (whose spanID is SpanIDB), then the ParentSpanID for SpanB is SpanIDA.
- If Span Y’s ParentSpanID is NULL/empty, then Span Y is a root span
References
| Resource | URL |
|---|---|
| SpanID in specs | specs/Trace/Span.TraceID |
| SpanID proto definition | specs/Trace/Span.SpanID |
TraceID
TraceID
TraceID is the identifier for a trace. It is globally unique and with sufficient entropy generated from 16 randomly generated bytes. It serves to group all the spans that belong to the same trace across all processes.
This field is REQUIRED for every span.
References
| Resource | URL |
|---|---|
| TraceID in specs | specs/Trace/Span.TraceID |
| TraceID proto definition | specs/Trace/TraceID.TraceID |
ParentSpanID
ParentSpanID
ParentSpanID can either but NULL/empty or contain the 8 byte SpanID of the span that caused this span.
- A span without a ParentSpanID is called a “Root span”
- A span with a ParentSpanID is called a “Child span”
- Many spans can have the same ParentSpanID and they are all children of the parent
- A span can ONLY have one parent
- A child span can also be a parent of a span that it spawns
References
| Resource | URL |
|---|---|
| ParentSpanID in specs | specs/Trace/Span.ParentTraceID |
| ParentSpanID proto definition | specs/Trace/Span.ParentSpanID |
StartTime/EndTime
StartTime
StartTime is a timestamp that records when the span was started.
EndTime
EndTime is a timestamp that records when the span’s operation has been ended
Latency
Latency is the difference between the EndTime and StartTime
Span Lifetime
Span lifetime represents the process of recording the start and the end timestamps to the Span object:
- The start time is recorded when the Span is created. A span is only alive iff its StartTime has been recorded.
- The end time needs to be recorded when the operation is ended. It is important that a span be ended after its tracking operation ends.
The life of a span during an RPC or HTTP request is discussed under context propagation.
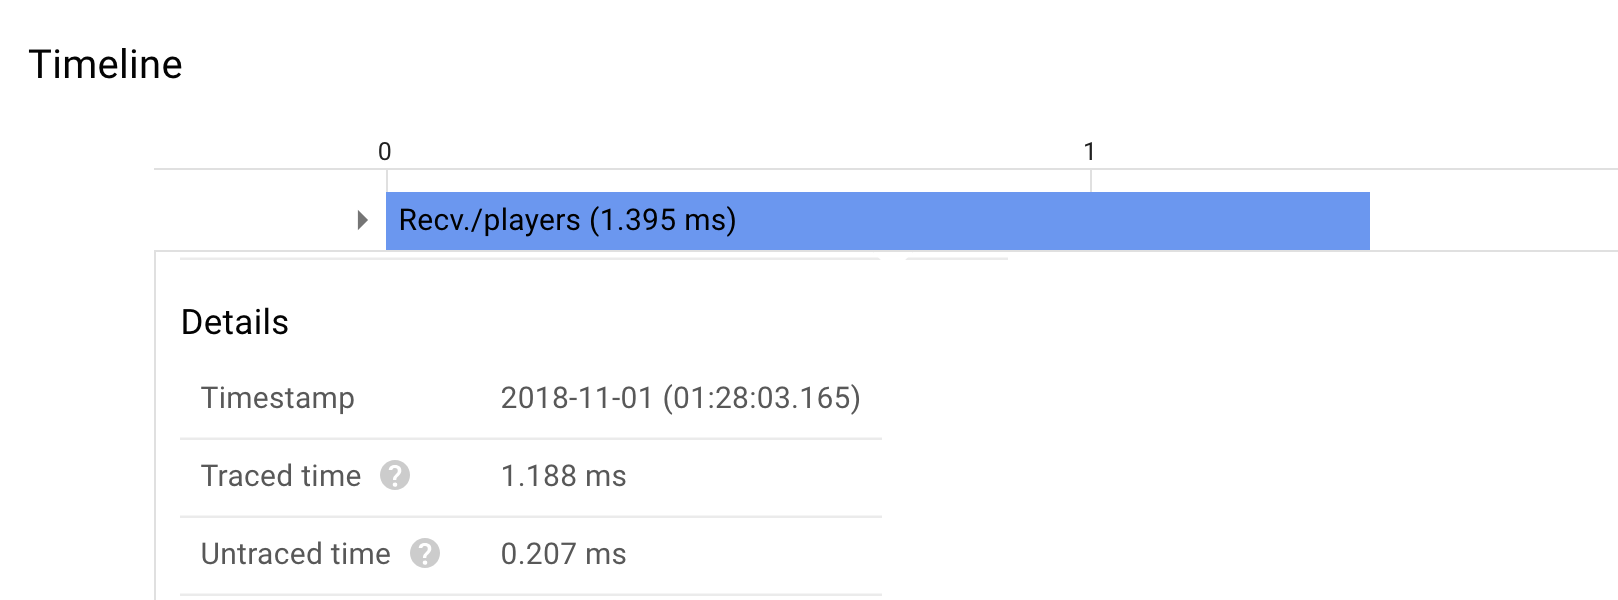
Visual
The visual below shows a span “Recv./players” whose StartTime was 2018-11-01 (01:28:03.165) and
- Latency = EndTime - StartTime = 1.188ms
References
| Resource | URL |
|---|---|
| StartTime proto | proto/v1.Span.StartTime |
| EndTime proto | proto/v1.Span.EndTime |
Status
Status
Status defines a logical error model to represent a filterable state of the span at a point in time.
It consists of a code whose type is int32 as well as the descriptive message.
Status allows tracing visualization tools to highlight unsuccessful spans and helps in debugging errors.
Status code mapping
For a uniform mapping of status code in various RPC systems, we use the following enumerations alongside description to describe the state of the system in span, as per:
| State | Code | Description | HTTP status code equivalent |
|---|---|---|---|
| OK | 0 | Not an error, returned on success | 200 and 2XX HTTP statuses |
| CANCELLED | 1 | The operation was cancelled, typically by the caller | 499 |
| UNKNOWN | 2 | An unknown error raised by APIs that don’t return enough error information | 500 |
| INVALID_ARGUMENT | 3 | The client specified an invalid argument | 400 |
| DEADLINE_EXCEEDED | 4 | The deadline expired before the operation could succeed | 504 |
| NOT_FOUND | 5 | Content was not found or request was denied for an entire class of users | 404 |
| ALREADY_EXISTS | 6 | The entity attempted to be created already exists | 409 |
| PERMISSION_DENIED | 7 | The caller doesn’t have permission to execute the specified operation | 403 |
| RESOURCE_EXHAUSTED | 8 | The resource has been exhausted e.g. per-user quota exhausted, file system out of space | 429 |
| FAILED_PRECONDITION | 9 | The client shouldn’t retry until the system state has been explicitly handled | 400 |
| ABORTED | 10 | The operation was aborted | 409 |
| OUT_OF_RANGE | 11 | The operation was attempted past the valid range e.g. seeking past the end of a file | 400 |
| UNIMPLEMENTED | 12 | The operation is not implemented or is not supported/enabled for this operation | 501 |
| INTERNAL | 13 | Some invariants expected by the underlying system have been broken. This code is reserved for serious errors | 500 |
| UNAVAILABLE | 14 | The service is currently available e.g. as a transient condition | 503 |
| DATA_LOSS | 15 | Unrecoverable data loss or corruption | 500 |
| UNAUTHENTICATED | 16 | The requester doesn’t have valid authentication credentials for the operation | 401 |
Source code samples
span.setStatus(status.NOT_FOUND.withDescription("Cache miss"))Visuals
- Not found on cache miss

As you can see above, we set the status with a message of “Cache miss” and a code of NOT_FOUND
References
| Resource | URL |
|---|---|
| Status in OpenCensus datamodel | proto/v1/Status |
| RPC code mappings | Code enumerations rpc/code.proto |
| Go API | Span.SetStatus |
| Java API | Span.SetStatus |
| Python API | Status |
| C++ API | Span.SetStatus |
Time events
Time event
It describes an event that happened at a point in time during a span’s lifetime. A time event can consist of EITHER of these fields but NOT BOTH
Time events
Time events are a collection of time event values but also retains information about the number of dropped annotations as well as number of dropped time events
Succinctly, time events contain these fields:
- A collection of Time events
- Number of dropped annotations
- Number of dropped message events
References
| Resource | URL |
|---|---|
| Data model reference | proto/trace/v1/trace.proto#TimeEvents |
Annotation
Annotation
An annotation tells a descriptive story in text, of an event that occurred during a span’s lifetime.
It consists of fields:
| Field | Information |
|---|---|
| Description | The user supplied message that details the event |
| Attributes | A set of attributes to articulate the annotate |
Code examples
We’ll add an annotation to a span in the excerpts with a couple of languages:
import io.opencensus.trace.AttributeValue;
import java.util.HashMap;

HashMap<String, AttributeValue> map = new HashMap<String, AttributeValue>();
map.put("store", AttributeValue.stringAttributeValue("memcache"));
map.put("cache_miss", AttributeValue.booleanAttributeValue(true));
map.put("age_ns", AttributeValue.int64AttributeValue(13488999));

span.addAnnotation(Annotation.fromDescriptionAndAttributes("Cache miss during GC", map));
Visual representation

References
| Resource | URL |
|---|---|
| Data model reference | trace_proto/v1.Annotation |
| Go annotation API: Span.Annotate | GoDoc |
| Java annotation API: Span.addAnnotation | JavaDoc |
| Python annotation API | Definition |
| C++ annotation API | Definition |
Message events
Message event
A message event describes a message sent or received between spans.
It contains the following fields:
Type
Type enumerates the various states of a message event. It can be either of these:
| Type | Value | Description |
|---|---|---|
| SENT | 1 | Indicates that this message was sent |
| RECEIVED | 2 | Indicates that this message was received |
| UNKNOWN | 0 | Unknown event type or default value |
ID
The identifier for the message to help correlate between SENT and RECEIVED message events. For example it can be useful when matching sequence/state numbers between protocol handshakes or for a streaming RPC. It is recommended to be unique within a span.
Uncompressed size
The number of uncompressed bytes sent or received.
Compressed size
The number of compressed bytes sent or received. If this value is zero, it is assumed to be the same as Uncompressed size
import io.opencensus.trace.MessageEvent;
import io.opencensus.trace.MessageEvent.Type;
// On the client
MessageEvent clientEvent = MessageEvent.builder(Type.RECEIVED, seqNumber)
.setCompressedMessageSize(512)
.setUncompressedMessageSize(1024)
.build();
clientSpan.addMessageEvent(clientEvent);
// On the server
MessageEvent serverEvent = MessageEvent.builder(Type.SENT, seqNumber)
.setCompressedMessageSize(512)
.setUncompressedMessageSize(1024)
.build();
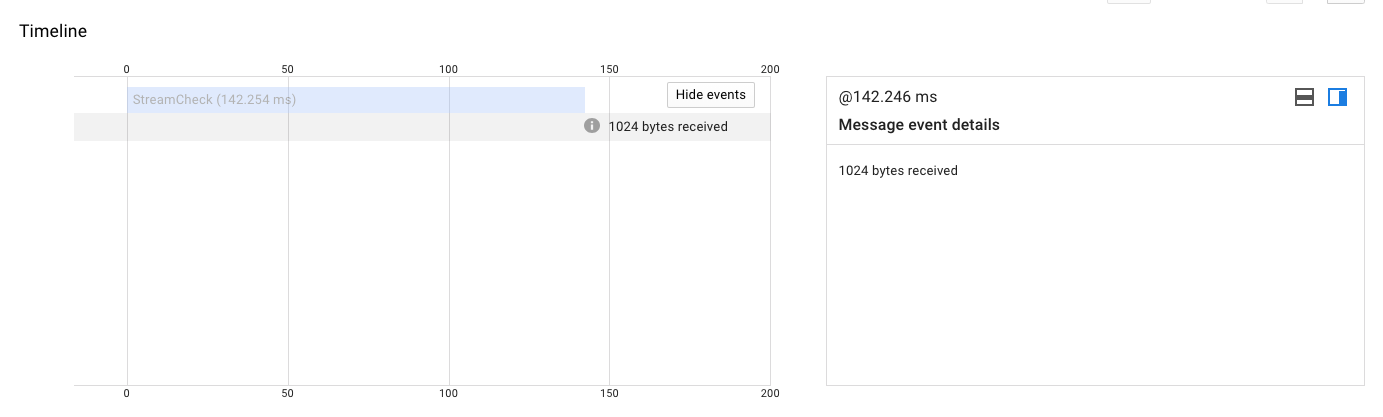
serverSpan.addMessageEvent(serverEvent);Visuals
-
Received
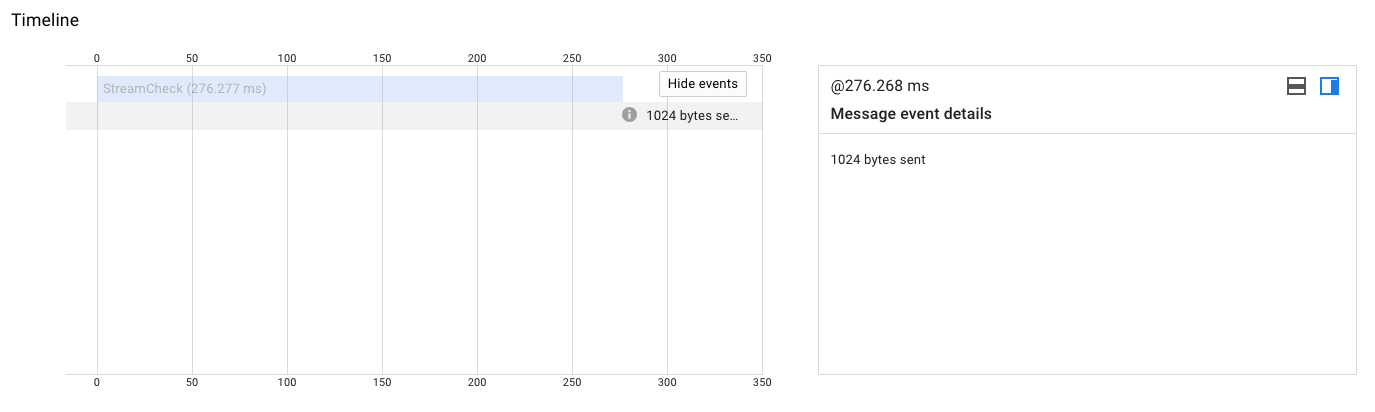
-
Sent
References
| Resource | URL |
|---|---|
| Message event definition | proto/v1/message_event |
| Go API | Span.AddMessageReceiveEvent Span.AddMessageSendEvent |
| Java API | MessageEvent JavaDoc |
| C++ API | Span.AddMessageReceivedEvent and Span.AddMessageSentEvent |
| Python API | MessageEvent Span.add_time_event |
Link
Link
A link describes a cross-relationship between spans in either the same or different trace. For example if a batch operation were performed, comprising of different traces or different processes, a link from one span to another can help correlate related spans.
Constituents
It consists of fields:
- TraceID
- SpanID
- Type which can either be
CHILD,PARENTorUNKNOWN - Attributes
Uses and advisory
-
Linking spans is especially useful for RPCs that might cross trust boundaries. For example, if your API client libraries in your customers’ applications and in the wild make calls to your cloud, you could choose to create a span when the request hits your cloud’s frontend server but not show it to the user, or at least prevent the trace from the wild from being the parent span to your internal spans
-
Links can also be used in tracing streaming requests such as with gRPC where tracing a long-lived request doesn’t provide valuable insight but per-message streaming will provide information about the latencies. On receiving a streamed message, you’ll need to link the trace that started this message
-
Links can also be used in batching operations or with asynchronous processing whereby a single trace spawned work that gets performed later. A link is important to help find the source of the trace that started the long-lived operations
Please also take a look at specs/utils.HandlingUntrustedRequests
Source code samples
In these source code samples, we have two spans:
| Name | Description |
|---|---|
| SpanA | Started from an untrusted boundary e.g. a client request to your cloud |
| SpanB | Started from a trusted boundary e.g. from the frontend server of your service/cloud |
// SpanA started say on the client side
// SpanB started on the server side
Scope s1 = tracer.spanBuilder("SpanA").startScopedSpan();
SpanContext spanASC = tracer.getCurrentSpan().getContext();
s1.close();

Scope s2 = tracer.spanBuilder("SpanB").startScopedSpan();
Map<String, AttributeValue> linkAttributes = new HashMap<>();
linkAttributes.put("reason", AttributeValue.stringAttribute("client-RPC unverified source"));
tracer.getCurrentSpan().addLink(
  Link.fromSpanContext(spanASC, Link.Type.CHILD_LINKED_SPAN, linkAttributes));
s2.close();
Visuals
When examined after being exported 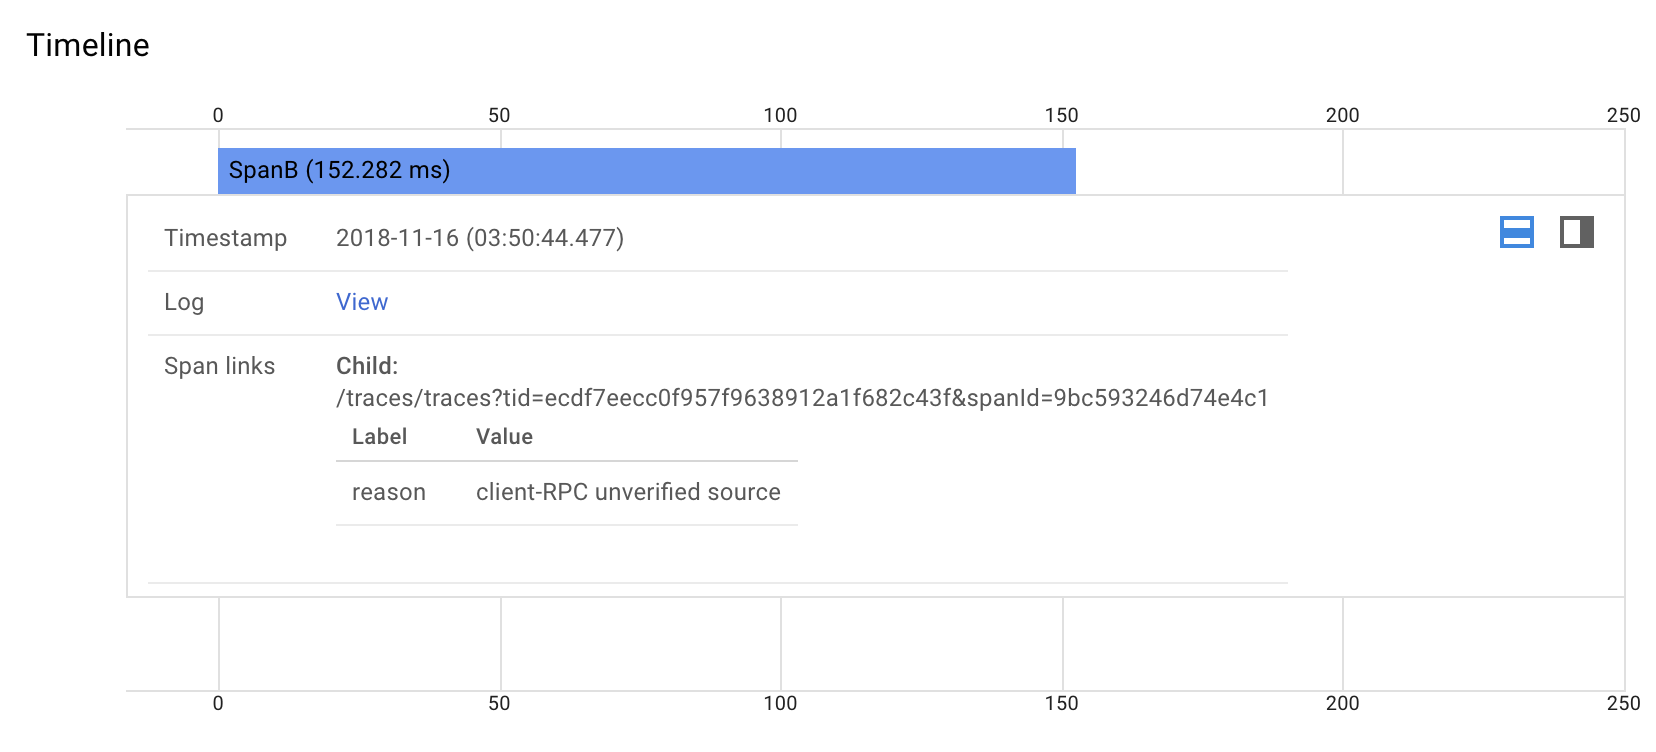
References
| Resource | URL |
|---|---|
| Handling untrusted requests | specs/utils.HandlingUntrustedRequests |
| Data model | proto/trace/v1.Link |
| Go API reference | Span.AddLink and Link |
| Java API reference | Span.addLink and Link |
| Python API reference | Span.add_link and Link |
| Node.js API reference | Span.addLink and Link |
SpanKind
SpanKind
SpanKind
SpanKind details the relationships between spans in addition to the parent/child relationship. SpanKind is enumerated by the following values:
| Type | Value | Meaning |
|---|---|---|
| SERVER | 1 | The span covers the server-side handling of an RPC |
| CLIENT | 2 | The span covers the client-side handling of an RPC |
| UNSPECIFIED | 0 | Unspecified |
For example, given two spans that share the same name and traceID, if a trace starts on the client and then progresses to the server for continuity, their Kind can be set as CLIENT and SERVER respectively
import io.opencensus.common.Scope;
import io.opencensus.trace.Span.Kind;

// Started on the client
try (Scope ss = TRACER.spanBuilder("SpanStarted").setSpanKind(Kind.CLIENT).startSpan()) {
}

// Started on the server
try (Scope ss = TRACER.spanBuilder("SpanStarted").setSpanKind(Kind.SERVER).startSpan()) {
}
References
| Resource | URL |
|---|---|
| SpanKind proto | proto/trace/v1.Span.SpanKind |
| Go API | WithSpanKind option |
| Java API | Span.Kind JavaDoc |
| Python API | span.SpanKind |
| Node.js API | span.SpanKind |
TraceOptions
TraceOptions
TraceOptions is a byte on each OpenCensus span. Currently its last bit is set iff the span is sampled otherwise it is clear. Perhaps this table might help clarify better
| State in hex | State in binary | Meaning |
|---|---|---|
| 0x00 | 00000000 | Span IS NOT sampled |
| 0x01 | 00000001 | Span IS sampled |
References
| Resource | URL |
|---|---|
| TraceOptions in the OpenCensus specs | https://github.com/census-instrumentation/opencensus-specs/blob/master/trace/Span.md#traceoptions |
Tracestate
Tracestate
Tracestate conveys information about the position/ordering of a request in multiple distributed tracing graphs. It consists of a list of at most 32 ordered Tracestate entries.
Entry
A tracestate entry is a key-value pair used to annotate a positional state. It consists of:
| Field | Description | Restrictions |
|---|---|---|
| Key | a collection of characters | MUST begin with a lower case letter, can contain lowercase alphanumeric, dashes, asterisk and forward slashes |
| Value | a collection of characters | ONLY printable ASCII characters |