可视化计算——数组计算与曲线绘图(续)
①地图制作——世界地震地点绘制
目前有很多网站在对地震进行实时报道,如中国地震信息网,Earthquake Hazards Program,Feeds and Notifications (Spreadsheet)等.
在此我们利用http://earthquake.usgs.gov/earthquakes/feed/v1.0/summary/4.5_month.csv网站上获得近30天4.5级地震以上的数据.(输入此网站会直接弹出一个下载界面,下载出来的表格即包含了30天至目前的地震数据,在后缀名中的/4.5_month就指的是4.5级以上的近一个月的数据,你也可以将month改为day,将4.5改成其他等级)
比如我现在获得了一个表格的数据如下:
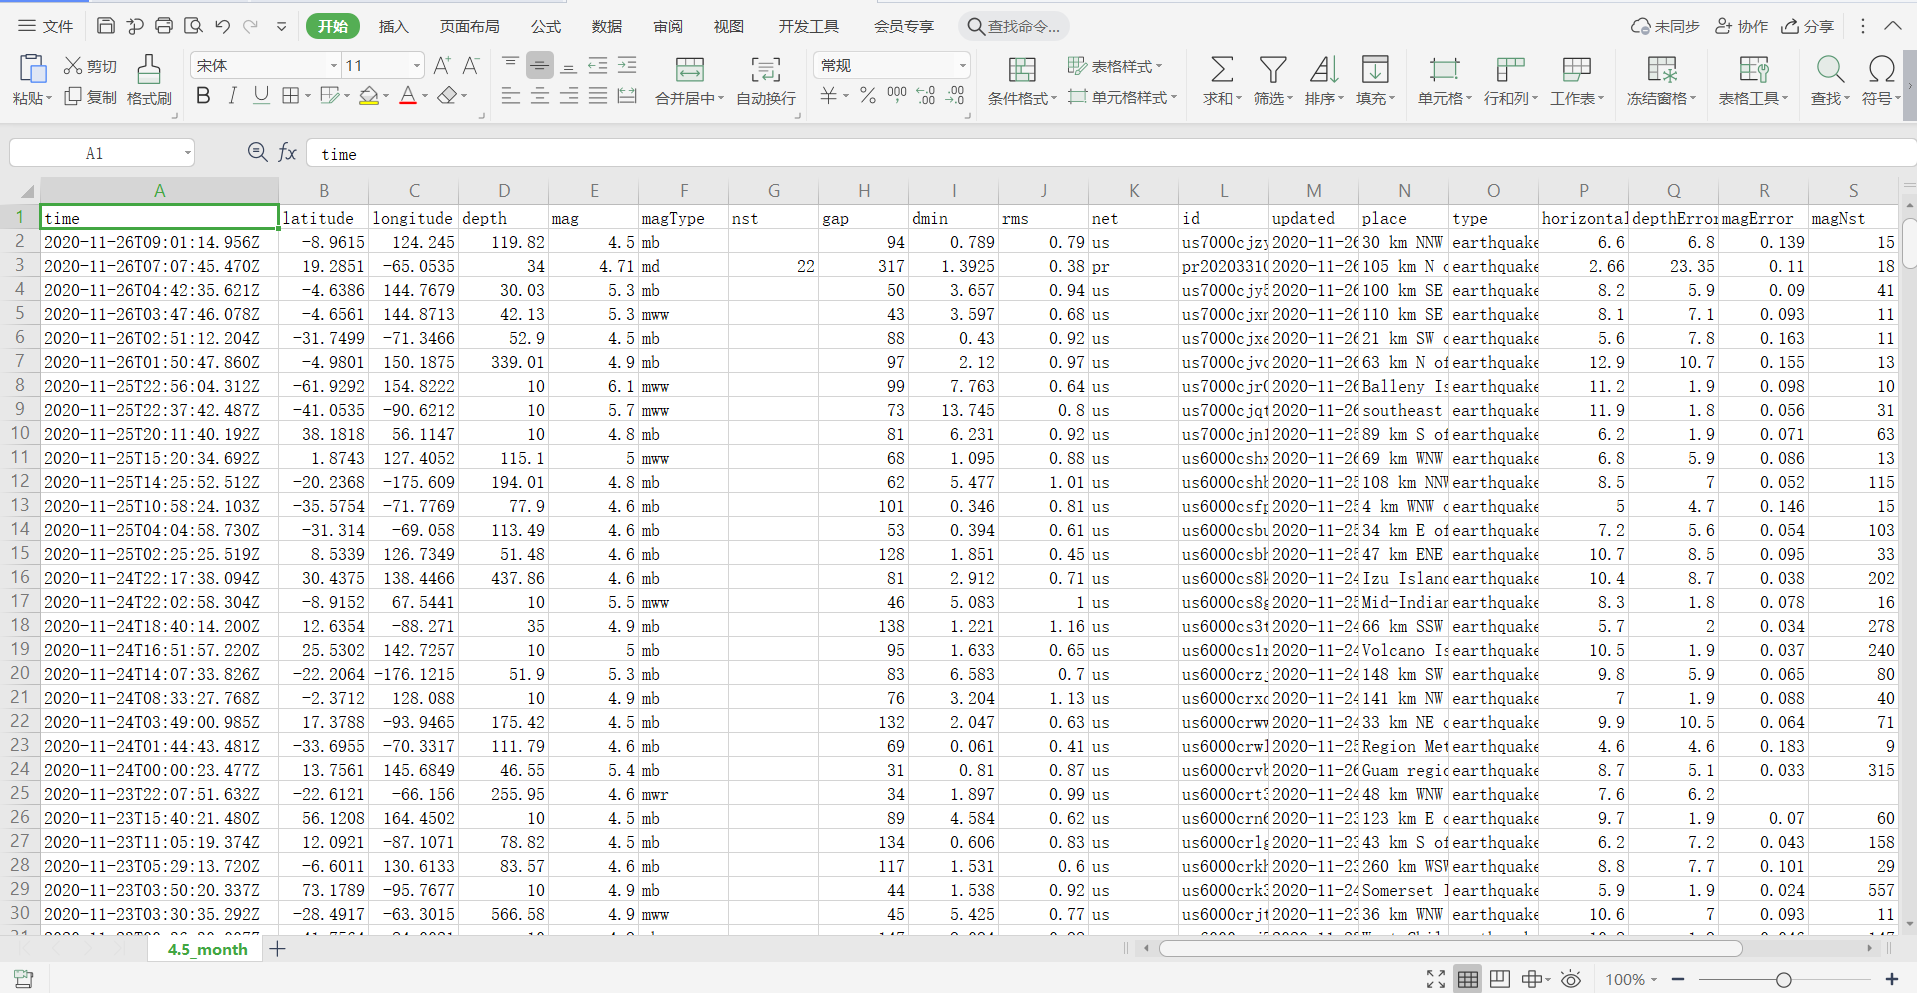
但是我们想将网络中的数据录入到python里面,就需要用到如下代码:
import urllib.request as req  #URL处理数据模块库
data=req.urlopen('http://earthquake.usgs.gov/earthquakes/feed/v1.0/summary/4.5_month.csv').read()
#urlopen创建一个远程url的类文件对象
#或者写成
import urllib.request as req
feed='http://earthquake.usgs.gov/earthquakes/feed/v1.0/summary/'
url=feed+'4.5_month.csv'
datafile=req.urlopen(url)
data=datafile.read()  #read读取内容
这样我们获得了网站上的数据,但是数据的书写内容还不清楚,所以我们应该先print(data)分析一下数据的情况(由于一个月的数据太多了,这里只截取一天的):
b'time,latitude,longitude,depth,mag,magType,nst,gap,dmin,rms,net,id,updated,place,type,horizontalError,depthError,magError,magNst,status,locationSource,magSource
2020-11-26T09:01:14.956Z,-8.9615,124.245,119.82,4.5,mb,,94,0.789,0.79,us,us7000cjzy,2020-11-26T09:31:15.040Z,"30 km NNW of Pante Makasar, Timor Leste",earthquake,6.6,6.8,0.139,15,reviewed,us,us
2020-11-26T07:07:45.470Z,19.2851,-65.0535,34,4.71,md,22,317,1.3925,0.38,pr,pr2020331007,2020-11-26T08:44:54.572Z,"105 km N of Charlotte Amalie, U.S. Virgin Islands",earthquake,2.66,23.35,0.11,18,reviewed,pr,pr
2020-11-26T04:42:35.621Z,-4.6386,144.7679,30.03,5.3,mb,,50,3.657,0.94,us,us7000cjy5,2020-11-26T04:55:44.040Z,"100 km SE of Angoram, Papua New Guinea",earthquake,8.2,5.9,0.09,41,reviewed,us,us
2020-11-26T03:47:46.078Z,-4.6561,144.8713,42.13,5.3,mww,,43,3.597,0.68,us,us7000cjxn,2020-11-26T04:06:53.143Z,"110 km SE of Angoram, Papua New Guinea",earthquake,8.1,7.1,0.093,11,reviewed,us,us
2020-11-26T02:51:12.204Z,-31.7499,-71.3466,52.9,4.5,mb,,88,0.43,0.92,us,us7000cjxe,2020-11-26T04:29:04.040Z,"21 km SW of Illapel, Chile",earthquake,5.6,7.8,0.163,11,reviewed,us,us
2020-11-26T01:50:47.860Z,-4.9801,150.1875,339.01,4.9,mb,,97,2.12,0.97,us,us7000cjvc,2020-11-26T02:09:57.040Z,"63 km N of Kimbe, Papua New Guinea",earthquake,12.9,10.7,0.155,13,reviewed,us,us
2020-11-25T22:56:04.312Z,-61.9292,154.8222,10,6.1,mww,,99,7.763,0.64,us,us7000cjr0,2020-11-26T01:00:22.645Z,"Balleny Islands region",earthquake,11.2,1.9,0.098,10,reviewed,us,us
2020-11-25T22:37:42.487Z,-41.0535,-90.6212,10,5.7,mww,,73,13.745,0.8,us,us7000cjqt,2020-11-26T00:41:18.112Z,"southeast of Easter Island",earthquake,11.9,1.8,0.056,31,reviewed,us,us
2020-11-25T20:11:40.192Z,38.1818,56.1147,10,4.8,mb,,81,6.231,0.92,us,us7000cjn1,2020-11-25T21:33:01.998Z,"89 km S of Serdar, Turkmenistan",earthquake,6.2,1.9,0.071,63,reviewed,us,us
2020-11-25T15:20:34.692Z,1.8743,127.4052,115.1,5,mww,,68,1.095,0.88,us,us6000cshx,2020-11-26T01:57:54.040Z,"69 km WNW of Tobelo, Indonesia",earthquake,6.8,5.9,0.086,13,reviewed,us,us
2020-11-25T14:25:52.512Z,-20.2368,-175.609,194.01,4.8,mb,,62,5.477,1.01,us,us6000cshb,2020-11-25T14:47:55.040Z,"108 km NNW of Nukuxe2x80x98alofa, Tonga",earthquake,8.5,7,0.052,115,reviewed,us,us
2020-11-25T10:58:24.103Z,-35.5754,-71.7769,77.9,4.6,mb,,101,0.346,0.81,us,us6000csfp,2020-11-25T12:53:13.441Z,"4 km WNW of San Javier, Chile",earthquake,5,4.7,0.146,15,reviewed,us,us
'
通过对数据的观察,我们可以发现一定的规律:
1.第一行介绍了各个数据的涵义,我们需要的是time(时间),latitude(纬度),longitude(经度),mag(地震等级),这些数据分别在列表的第0,1,2,4列
2.每组数据都由换行符'
'分隔开
3.每个数据之间由','分隔开
4.不需要第0行(题头)和最后一行(空白)
因此我们可以对数据进行一定的处理:
import urllib.request as req  #URL处理数据模块库
data=req.urlopen('http://earthquake.usgs.gov/earthquakes/feed/v1.0/summary/4.5_month.csv').read()
data=str(data,encoding='ascii',errors='ignore')    #将数据转化为字符串类型,并且解码,忽略错误
#网上的数据不能直接用来分割,需要解码,否则会出现‘a bytes-like object is required, not 'str'’的问题
lines=data.split('
')          #以
将数据分割
lines=lines[1:-1]               #只取除第一行和最后一行的数据
times=[0]*len(lines)            #创建四个全0列表
latitude=[0]*len(lines)
longitude=[0]*len(lines)
mag=[0]*len(lines)
for i in range(len(lines)):
    temp=lines[i].split(',')    #将每个组的数据以','分隔后存储到temp里
    times[i]=temp[0]            #将第一个数据添加进times
    latitude[i]=temp[1]
    longitude[i]=temp[2]
    mag[i]=temp[4]
这样就得到了一个月的时间,纬度,经度和地震强度的列表.
现在我们要运用这些经纬度在世界地图上把地理位置标出来,就需要basemap库(我直接在anaconda的环境中下载的basemap,也可以去找清华源)
#载入地图绘制库
from mpl_toolkits.basemap import Basemap
#设定地图参数
map=Basemap(projection='robin',lon_0=0,resolution='c')
map.drawcoastlines(linewidth=0.25)#画海岸线
map.drawcountries(linewidth=0.25)#画国界线
map.drawmapboundary(fill_color=(0.8,0.95,1.0))#画地图边界并填充海洋
map.fillcontinents(color=(1,0.9,0.7),lake_color=(0.8,0.95,1.0),zorder=0)#填充国家颜色和湖泊颜色
在Basemap中:project为投影方式,包括Robinson 罗宾逊投影、Orthographic 正射投影等,默认投影为‘cyl’(圆柱投影).具体可以去官网https://matplotlib.org/basemap/users/mapsetup.html查看
resolution参数设置分辨率级别,有'c'(原始),'l'(低),'i'(中),'h'(高),'f'(完整)或None(如果没有使用边界)
lon_0和lat_0表示地图中心点
现在我们运用上面的代码将一个月的地震位置在世界地图上标注出来:
import urllib.request as req
from mpl_toolkits.basemap import Basemap
import matplotlib.pyplot as plt
data=req.urlopen('http://earthquake.usgs.gov/earthquakes/feed/v1.0/summary/4.5_month.csv').read()
data=str(data,encoding='ascii',errors='ignore')
lines=data.split('
')
lines=lines[1:-1]
times=[0]*len(lines)
latitude=[0]*len(lines)
longitude=[0]*len(lines)
mag=[0]*len(lines)
for i in range(len(lines)):
temp=lines[i].split(',')
latitude[i]=temp[1]
longitude[i]=temp[2]
mag[i]=temp[4]
latitude=[float(p) for p in latitude] #将字符串类型转换为浮点数
longitude=[float(q) for q in longitude]
from mpl_toolkits.basemap import Basemap
map=Basemap(projection='robin',lon_0=0,resolution='c')
map.drawcoastlines(linewidth=0.25)
map.drawcountries(linewidth=0.25)
map.drawmapboundary(fill_color=(0.8,0.95,1.0))
map.fillcontinents(color=(1,0.9,0.7),lake_color=(0.8,0.95,1.0),zorder=0)
for e in range(len(lines)):
x,y=map(longitude[e],latitude[e]) #将经度和纬度的数据分别存储在x,y里(注意这里经纬反了一下)
map.scatter(x,y,s=30,marker='o',color='r') #用scatter画散点图,s是圆点的大小,marker是样式,color为颜色
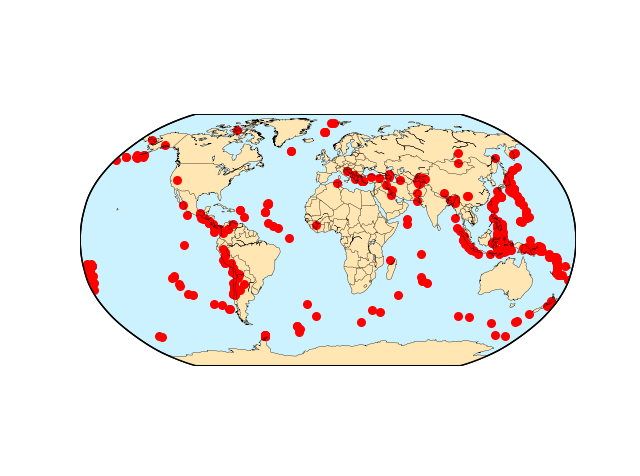
plt.show()
效果如下:
如果我们想在地图上标注出北京的位置,需要先查找北京的经纬度,添上这样一段代码:
#北京的经纬度
latitudeBeijing  = 39.91
longitudeBeijing = 116.39
# 将经纬度转换为图像中的位置(注意参数分别是经度、纬度)
x, y = map(longitudeBeijing, latitudeBeijing)
# 绘制圈中点的首都符号:
map.scatter(x, y, s = 10, marker='o', color='r') # 实心红点
map.scatter(x, y, s = 60, marker='o', color='None’, edgecolor='r') # 空心红圈
# 标记汉字“北京”字样
plt.text(x, y, u'北京', color = 'b', fontsize=10)
#如果不想让点和标记重合,可将标记稍稍移动,在x后加上一个比较大的数(如x+1000000,y+4000000)
当使用'ortho'投影方式时,会有视图看不见的点,这个时候就可以用if去掉视图中不可见的部分:
if -90<=longitude<=90:
    x,y=map(longitude,latitude)
②动画模拟——世界地震地点实时报道
制作动画我们需要导入动画库,调用FuncAnimation编写更新函数:
from matplotlib.animation import FuncAnimation
def update(frame):
    x,y=map(longitude[frame],latitude[frame])
    map.scatter(x,y,s=30,color='r',marker='o')
animation=FuncAnimation(fig,update,interval=100)
plt.show()
FuncAnimation参数:
1.frame:不断提供frame给updata用于生成新的xdata和ydata,默认的frame可以每次提供一个从0到无穷大的数,也可以自定义frame如frame=np.linspace(0,20000,5)
2.update:不断更新图像的函数
3.interval:刷新图像时间间隔,以ms为单位
4.fig:figure对象
这样我们就可以制作一个显示地震点的动图:
import urllib.request as req
from mpl_toolkits.basemap import Basemap
import matplotlib.pyplot as plt
from matplotlib.animation import FuncAnimation
data=req.urlopen('http://earthquake.usgs.gov/earthquakes/feed/v1.0/summary/4.5_month.csv').read()
data=str(data,encoding='ascii',errors='ignore')
lines=data.split('
')
lines=lines[1:-1]
N=len(lines)
times=[0]*N
latitude=[0]*N
longitude=[0]*N
mag=[0]*N
fig=plt.figure(figsize=[10,10])
for i in range(N):
    temp=lines[i].split(',')
    latitude[i]=temp[1]
    longitude[i]=temp[2]
    mag[i]=temp[4]
latitude=[float(p) for p in latitude]     #将字符串类型转换为浮点数
longitude=[float(q) for q in longitude]
from mpl_toolkits.basemap import Basemap
map=Basemap(projection='robin',lon_0=0,resolution='c')
map.drawcoastlines(linewidth=0.25)
map.drawcountries(linewidth=0.25)
map.drawmapboundary(fill_color=(0.8,0.95,1.0))
map.fillcontinents(color=(1,0.9,0.7),lake_color=(0.8,0.95,1.0),zorder=0)
def update(frame):
    x,y=map(longitude[frame%N],latitude[frame%N]) #frame取余的目的是让frame大于N后可以重复进行画图
    map.scatter(x,y,s=30,color='r',marker='o')
animation=FuncAnimation(fig,update,interval=100)
plt.show()
在此基础上,如果我们想要地震点逐一显示然后消失,则只需要将后面定义做一下改动:
scat=map.scatter(0,0,s=0,marker='o',color='r')    #在地图上描绘一个不可见(s=0)的起始点
def update(frame):
    x,y=map(longitude[frame%N],latitude[frame%N])
    scat.set(sizes=[80],offsets=[x,y])            #将点大小修正为80,并修改位置为[x,y],[x,y]由上面的map定义
animation=FuncAnimation(fig,update,interval=100)
plt.show()
如果想以20个点为一组进行逐一显示后消失,即设置缓冲区,则需要做如下改动:
scat=map.scatter(0,0,s=0,color='r',marker='o')      #在地图上绘制一个不可见的起始点
pointlimit=20       #最大缓存点数,及可见点的最大数目
points=np.zeros(4*pointlimit,dtype=float).reshape(4,pointlimit)
#这里创建了一个二维列表用于存储数据,其中每20个元素存在一个列表里,4个列表分别存储经度,纬度,地震强度,点大小四个数据
sizemax=300      #点大小的最大值
sizestep=30      #每次点增长的大小

def update(frame):
    recordindex=frame%N      #所有数据对应的下标
    pointindex=frame%pointlimit       #所有数据对应在存储空间里的下标(从0到19,共20个数据)

    points[3,:]=[((size+sizestep)%sizemax if size>0 else 0) for size in points[3,:]]
    #这里将点大小每次增加sizestep,增加到300(最大)时便消失
    points[0,pointindex],points[1,pointindex]=map(longitude[recordindex],latitude[recordindex])
    #将经度和纬度的数据分别储存在两个列表中
    points[2,pointindex]=mag[frame%N]
    #存储地震强度
    points[3,pointindex]=30
    #初始化点大小
    scat.set(sizes=points[3,:],offsets=list(zip(points[0,:],points[1,:])))
    #修改点的大小位置
animation=FuncAnimation(fig,update,interval=100)
plt.show()
这里解释一下zip的作用:
>>a=[1,2,3]
>>b=[4,5,6]
>>c=[1,2,3,4,5,6]
>>zip(a,b)
[(1,4),(2,5),(3,6)]
>>zip(a,c)
[(1,1),(2,2),(3,3)]
即zip可以将两个列表对应位置元素打包成为一个元组
需要注意的是python2与python3关于zip是不同的
python2返回结果为一个列表,python3则是一个可以遍历的对象
而在上述offsets里需要列表形式,python3就要先将遍历对象转化成list
另外,为了更加完善动画,我们想设置点的颜色随着强度变化而不同,透明度随着强度变化而不同:
# 颜色的缓冲区:
colors = [[0,0,1,1], [1,0,0,1]] # 两种颜色,前一种表示5.5级及以下,后一种表示5.5级以上
pointcolors = np.zeros(8*pointlimit, dtype=float).reshape(pointlimit,2,4) #edgecolor, facecolor

#将数据存入缓存:
pointcolors[pointindex,0,:]=(colors[0] if points[2,pointindex] < 5.5 else colors[1])# edgecolor
pointcolors[pointindex,1,:]=pointcolors[pointindex, 0, :]*(1,1,1,0.25) # facecolor

#修改颜色:
scat.set(edgecolor=pointcolors[:, 0, :], facecolor=pointcolors[:, 1, :])
补充:点的半透明:color*(1,1,1,0.25)
然后,我们还想让地震点的显示可以追踪到动态时间:
ax.set_xlabel(u"近30天大于4.5级强度的地震(红色大于5.5级)", fontsize=16)
ax.set_title('')

# 修改标题以显示动态时间(当前地震发生时间):
ax.set_title(times[recordindex])
最后,我们要将动画储存下来:
ani.save('earthquake.mp4', writer='ffmpeg', fps=20)
来看看最后的‘鸿篇巨制’:
import numpy as np
import urllib.request as req
from mpl_toolkits.basemap import Basemap
import matplotlib.pyplot as plt
from matplotlib.animation import FuncAnimation
fig,ax = plt.subplots()
data=req.urlopen('http://earthquake.usgs.gov/earthquakes/feed/v1.0/summary/4.5_month.csv').read()
data=str(data,encoding='ascii',errors='ignore')
lines=data.split('
')
lines=lines[1:-1]
N=len(lines)
times=[0]*N
latitude=[0]*N
longitude=[0]*N
mag=[0]*N
fig=plt.figure(figsize=[10,10])
for i in range(N):
    temp=lines[i].split(',')
    latitude[i]=temp[1]
    longitude[i]=temp[2]
    mag[i]=temp[4]
latitude=[float(p) for p in latitude]     #将字符串类型转换为浮点数
longitude=[float(q) for q in longitude]
from mpl_toolkits.basemap import Basemap
map=Basemap(projection='robin',lon_0=0,resolution='c')
map.drawcoastlines(linewidth=0.25)
map.drawcountries(linewidth=0.25)
map.drawmapboundary(fill_color=(0.8,0.95,1.0))
map.fillcontinents(color=(1,0.9,0.7),lake_color=(0.8,0.95,1.0),zorder=0)

ax.set_xlabel(u"近30天大于4.5级强度的地震(红色大于5.5级)", fontsize=16)
ax.set_title('')

scat=map.scatter(0,0,s=0,color='r',marker='o')      #在地图上绘制一个不可见的起始点
pointlimit=20       #最大缓存点数,及可见点的最大数目
points=np.zeros(4*pointlimit,dtype=float).reshape(4,pointlimit)
#这里创建了一个二维列表用于存储数据,其中每20个元素存在一个列表里,4个列表分别存储经度,纬度,地震强度,点大小四个数据
sizemax=300      #点大小的最大值
sizestep=30      #每次点增长的大小
# 颜色的缓冲区:
colors = [[0,0,1,1], [1,0,0,1]] # 两种颜色,前一种表示5.5级及以下,后一种表示5.5级以上
pointcolors = np.zeros(8*pointlimit, dtype=float).reshape(pointlimit,2,4) #edgecolor, facecolor

def update(frame):
    recordindex=frame%N      #所有数据对应的下标
    pointindex=frame%pointlimit       #所有数据对应在存储空间里的下标(从0到19,共20个数据)

    points[3,:]=[((size+sizestep)%sizemax if size>0 else 0) for size in points[3,:]]
    #这里将点大小每次增加sizestep,增加到300(最大)时便消失
    points[0,pointindex],points[1,pointindex]=map(longitude[recordindex],latitude[recordindex])
    #将经度和纬度的数据分别储存在两个列表中
    points[2,pointindex]=mag[frame%N]
    #存储地震强度
    pointcolors[pointindex,0,:]=(colors[0] if points[2,pointindex] < 5.5 else colors[1])# edgecolor
    pointcolors[pointindex,1,:]=pointcolors[pointindex, 0, :]*(1,1,1,0.25) # facecolor

    points[3,pointindex]=30
    #初始化点大小
    scat.set(sizes=points[3,:],offsets=list(zip(points[0,:],points[1,:])))
    #修改点的大小位置
    #修改颜色:
    scat.set(edgecolor=pointcolors[:, 0, :], facecolor=pointcolors[:, 1, :])
    # 修改标题以显示动态时间(当前地震发生时间):
    ax.set_title(times[recordindex])
animation=FuncAnimation(fig,update,interval=100)
plt.show()
卑微的我没找到怎么把动图放在博客上(//▲//)
结果还请自己探索咯!