安装prometheus
作者声明:本博客内容是作者在学习以及搭建过程中积累的内容,内容采自网络中各位老师的优秀博客以及视频,并根据作者本人的理解加以修改(由于工作以及学习中东拼西凑,如何造成无法提供原链接,在此抱歉!!!)
作者再次声明:作者只是一个很抠脚的IT工作者,希望可以跟那些提供原创的老师们学习
prometheus采用nfs挂载方式来存储数据,同时使用configMap管理配置文件。并且我们将所有的prometheus存储在kube-system
1.prometheus的configmap配置文件
#建议将所有的prometheus yaml文件存在一块
mkdir /opt/prometheus -p && cd /opt/prometheus

cat >> prometheus.configmap.yaml <<EOF
apiVersion: v1
kind: ConfigMap
metadata:
  name: prometheus-config
  namespace: kube-system
data:
  prometheus.yml: |
    global:
      scrape_interval: 15s
      scrape_timeout: 15s
    scrape_configs:
    - job_name: 'prometheus'
      static_configs:
      - targets: ['localhost:9090']
EOF

# 配置文件解释(这里的configmap实际上就是prometheus的配置)
上面包含了3个模块global、rule_files和scrape_configs

其中global模块控制Prometheus Server的全局配置
scrape_interval:表示prometheus抓取指标数据的频率,默认是15s,我们可以覆盖这个值
evaluation_interval:用来控制评估规则的频率,prometheus使用规则产生新的时间序列数据或者产生警报

rule_files模块制定了规则所在的位置,prometheus可以根据这个配置加载规则,用于生产新的时间序列数据或者报警信息,当前我们没有配置任何规则,后期会添加

scrape_configs用于控制prometheus监控哪些资源。由于prometheus通过http的方式来暴露它本身的监控数据,prometheus也能够监控本身的健康情况。在默认的配置有一个单独的job,叫做prometheus,它采集prometheus服务本身的时间序列数据。这个job包含了一个单独的、静态配置的目标;监听localhost上的9090端口。
prometheus默认会通过目标的/metrics路径采集metrics。所以,默认的job通过URL:http://localhost:9090/metrics采集metrics。收集到时间序列包含prometheus服务本身的状态和性能。如果我们还有其他的资源需要监控,可以直接配置在该模块下即可
2.prometheus的pod资源
配置文件创建完成,如果以后我们有新的资源需要被监控,我们只需要将ConfigMap对象更新即可,现在我们开始创建prometheus的Pod资源
apiVersion: extensions/v1beta1
kind: Deployment
metadata:
  name: prometheus
  namespace: kube-system
  labels:
    app: prometheus
spec:
  template:
    metadata:
      labels:
        app: prometheus
    spec:
      serviceAccountName: prometheus
      containers:
      - image: prom/prometheus:v2.4.3
        name: prometheus
        command:
        - "/bin/prometheus"
        args:
        - "--config.file=/etc/prometheus/prometheus.yml"
        - "--storage.tsdb.path=/prometheus"
        - "--storage.tsdb.retention=30d"
        - "--web.enable-admin-api"  # 控制对admin HTTP API的访问,其中包括删除时间序列等功能
        - "--web.enable-lifecycle"  # 支持热更新,直接执行localhost:9090/-/reload立即生效
        ports:
        - containerPort: 9090
          protocol: TCP
          name: http
        volumeMounts:
        - mountPath: "/prometheus"
          subPath: prometheus
          name: data
        - mountPath: "/etc/prometheus"
          name: config-volume
        resources:
          requests:
            cpu: 100m
            memory: 512Mi
          limits:
            cpu: 100m
            memory: 512Mi
      securityContext:
        runAsUser: 0
      volumes:
      - name: data
        persistentVolumeClaim:
          claimName: prometheus
      - configMap:
          name: prometheus-config
        name: config-volume
这里稍微讲解一下配置参数
我们在启动程序的时候,除了指定prometheus.yaml(configmap)以外,还通过storage.tsdb.path指定了TSDB数据的存储路径、通过storage.tsdb.rentention设置了保留多长时间的数据,还有下面的web.enable-admin-api参数可以用来开启对admin api的访问权限,参数web.enable-lifecyle用来开启支持热更新,有了这个参数之后,prometheus.yaml(configmap)文件只要更新了,通过执行localhost:9090/-/reload就会立即生效
我们添加了一行securityContext,,其中runAsUser设置为0,这是因为prometheus运行过程中使用的用户是nobody,如果不配置可能会出现权限问题
3.NFS搭建步骤,步骤简单不多说!!!
4.创建pv,pvc
prometheus.yaml文件对应的ConfigMap对象通过volume的形式挂载进Pod,这样ConfigMap更新后,对应的pod也会热更新,然后我们在执行上面的reload请求,prometheus配置就生效了。除此之外,对了将时间数据进行持久化,我们将数据目录和一个pvc对象进行了绑定,所以我们需要提前创建pvc对象
cat >>prometheus-volume.yaml <<EOF
apiVersion: v1
kind: PersistentVolume
metadata:
  name: prometheus
spec:
  capacity:
    storage: 10Gi
  accessModes:
  - ReadWriteOnce
  persistentVolumeReclaimPolicy: Recycle
  nfs:
    server: 10.4.82.138
    path: /data/k8s

---
apiVersion: v1
kind: PersistentVolumeClaim
metadata:
  name: prometheus
  namespace: kube-system
spec:
  accessModes:
  - ReadWriteOnce
  resources:
    requests:
      storage: 10Gi
EOF

#nfs
server nfs服务器ip
path  挂载点,提前挂在好,确保可以写入
kubectl create -f prometheus-volume.yaml
kubectl get pvc --all-namespaces
这里稍微提示一下,我们创建的pv和pvc大小都是10g,只是测试存储为10g。线上可以修改为200或者更多,一般prometheus数据保留15-30天就可以,如果数据量过大建议使用TSBD分布式存储
5.rbac认证
我们这里还需要创建rbac认证,因为prometheus需要访问k8s集群内部的资源
cat >>prometheus-rbac.yaml <<EOF
apiVersion: v1
kind: ServiceAccount
metadata:
  name: prometheus
  namespace: kube-system
---
apiVersion: rbac.authorization.k8s.io/v1
kind: ClusterRole
metadata:
  name: prometheus
rules:
- apiGroups:
  - ""
  resources:
  - nodes
  - services
  - endpoints
  - pods
  - nodes/proxy
  verbs:
  - get
  - list
  - watch
- apiGroups:
  - ""
  resources:
  - configmaps
  - nodes/metrics
  verbs:
  - get
- nonResourceURLs:
  - /metrics
  verbs:
  - get
---
apiVersion: rbac.authorization.k8s.io/v1beta1
kind: ClusterRoleBinding
metadata:
  name: prometheus
roleRef:
  apiGroup: rbac.authorization.k8s.io
  kind: ClusterRole
  name: prometheus
subjects:
- kind: ServiceAccount
  name: prometheus
  namespace: kube-system
EOF
由于我们要获取的资源,在每一个namespace下面都有可能存在,所以我们这里使用的是ClusterRole的资源对象,nonResourceURLs是用来对非资源型metrics进行操作的权限声明
kubectl create -f prometheus-rbac.yaml
6.运行prometheus服务
我们将ConfigMap volume rbac 创建完毕后,就可以创建prometheus.deploy.yaml了,运行prometheus服务
kubectl create -f prometheus.deploy.yaml
kubectl get pod --all-namespaces |grep prometheus
7.service服务
现在我们prometheus服务状态是已经正常了,但是我们在浏览器是无法访问prometheus的 webui服务。那么我们还需要创建一个service
cat >>prometeheus-svc.yaml <<EOF
apiVersion: v1
kind: Service
metadata:
  name: prometheus
  namespace: kube-system
  labels:
    app: prometheus
spec:
  selector:
    app: prometheus
  type: NodePort
  ports:
    - name: web
      port: 9090
      targetPort: http
EOF
kubectl create -f prometeheus-svc.yaml
kubectl get svc -n kube-system |grep prometheus
prometeheus界面
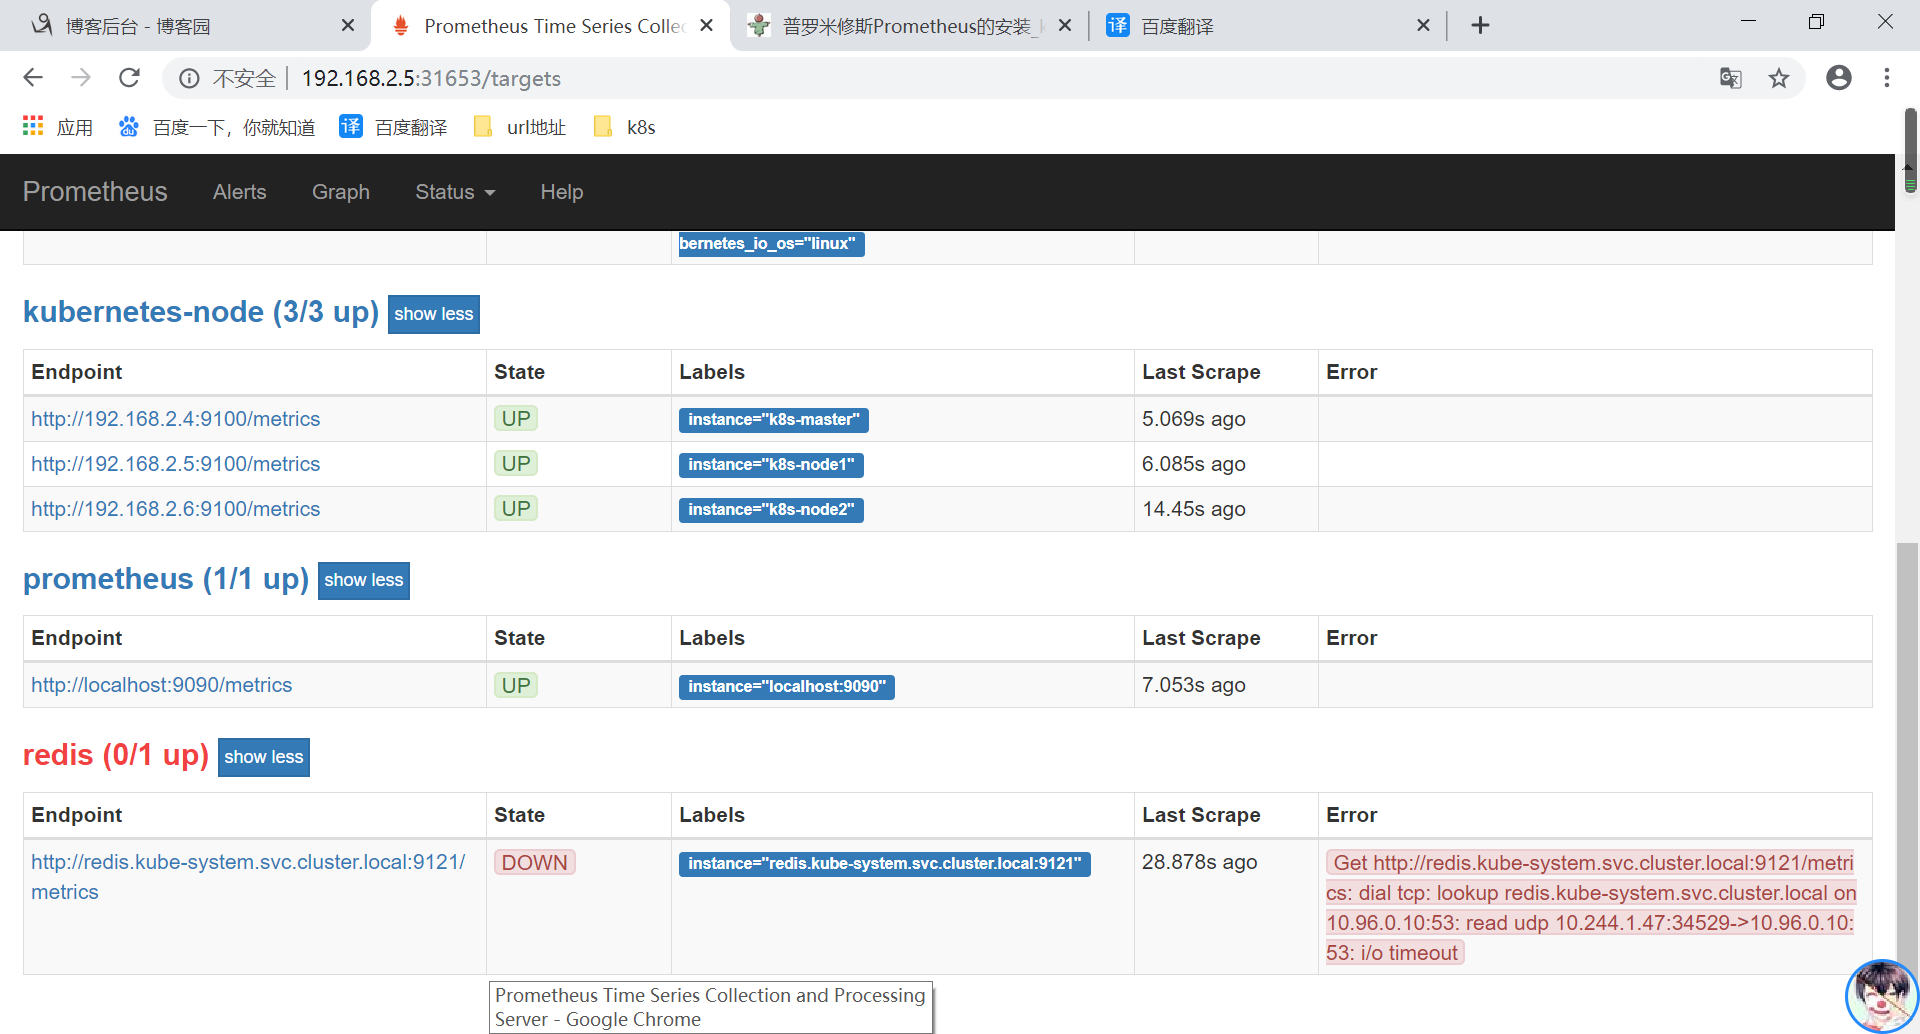
1.监控规则
Status-->Targets
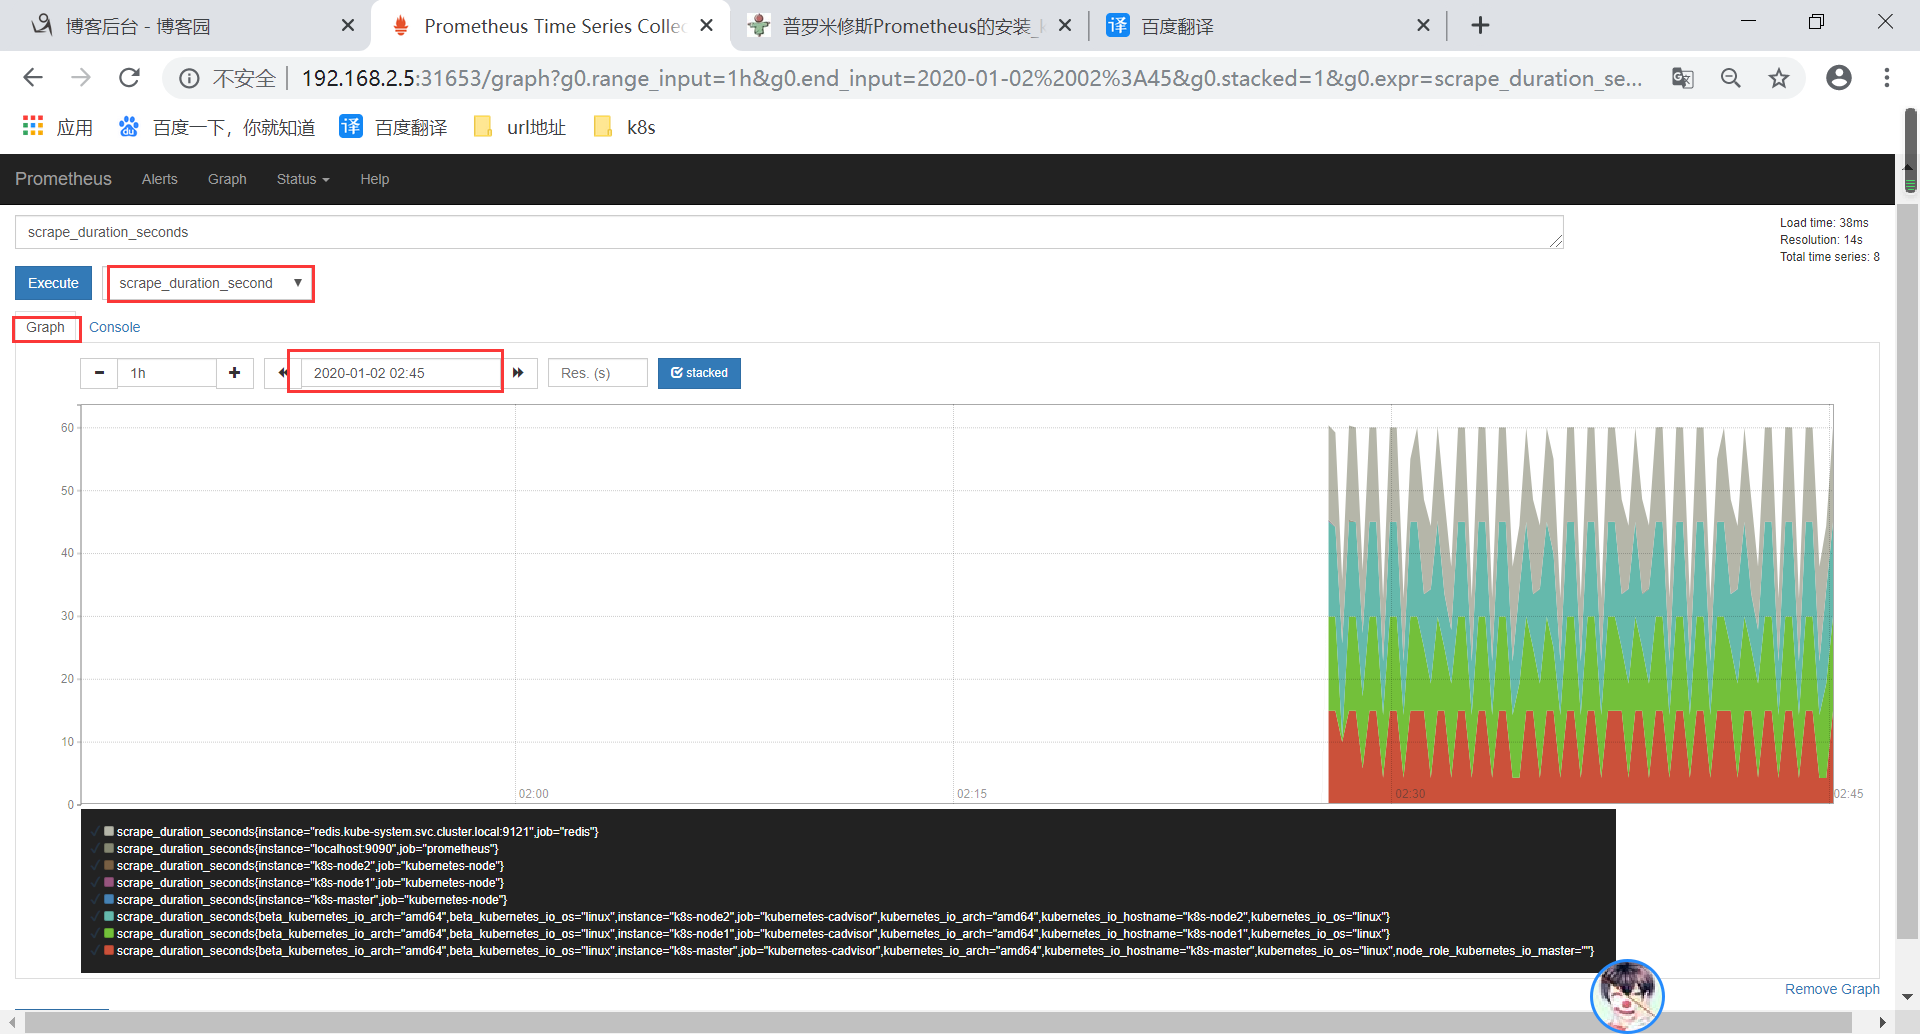
2.查看数据
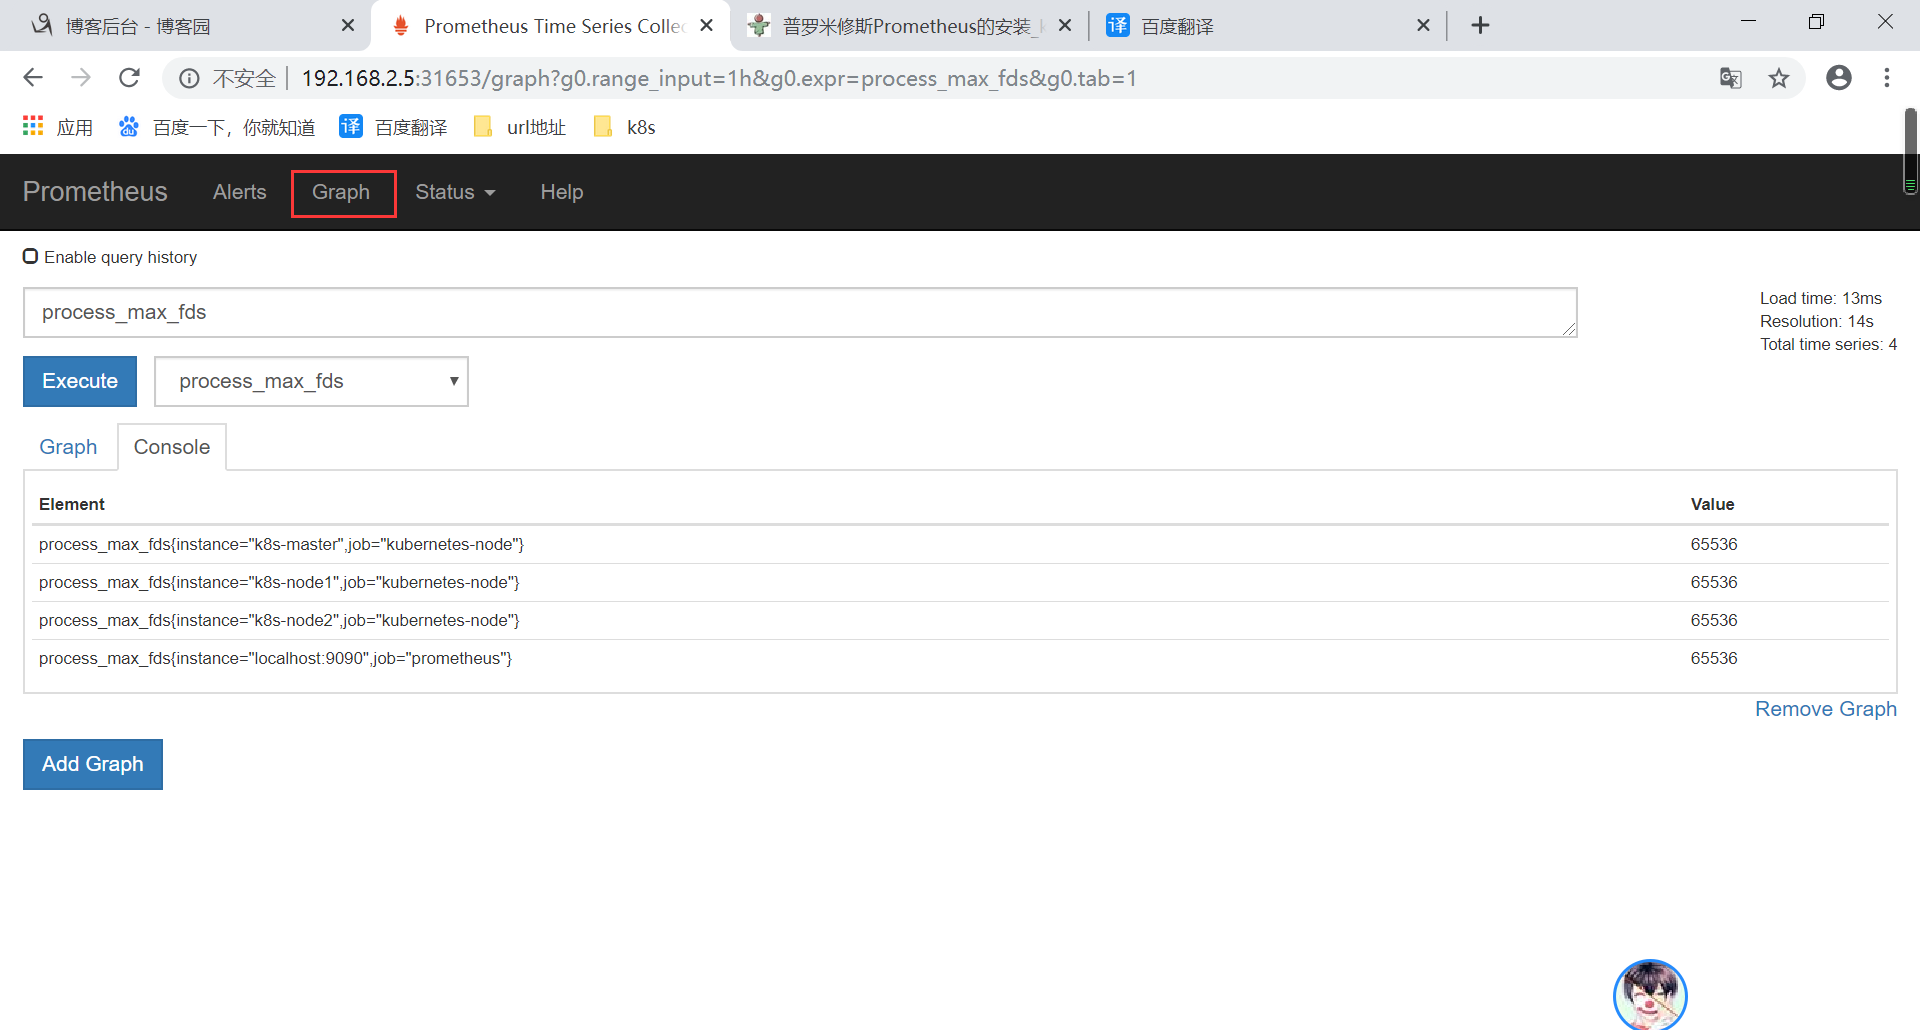
比如我们这里就选择scrape_duration_seconds这个指标,然后点击Execute,如果这个时候没有查询到任何数据,我们可以切换到Graph这个 tab 下面重新选择下时间,选择到当前的时间点,重新执行,就可以看到类似于下面的图表数据了:
少年不识愁滋味,爱上层楼。爱上层楼。为赋新词强说愁。 而今识尽愁滋味,欲说还休。欲说还休。却道天凉好个秋。